
- Home
- Seminal Contributions
- Cytometry History
- Research Centers
- Photo & Video
- Cytometry and Society
- Education & Research
- Sponsors
Home Education & Research Tarnok


Three-Part Analysis of Slide Based Cytometry, Confocal Imaging and Volume Rendering is the Key for Tissomics
by Attila Tarnok,a1 Anja Mittag,a,b Jens-Peer Kuska,c Ulf-Dietrich Braumann,b,c Birgit Mosch,d,e Thomas Arendte
- List of Contents
Abstract
For Cytomics, Tissomics and Systems Biology highly multiplexed analyses are required. Slide Based Cytometry (SBC) analysis yields such quantitative cell related data on various cell constituents. High-throughput analyses of hundred-thousands of objects are realizable. It obtain cytometric data on light absorption, scatter and fluorescence signals. Selected cells of interest can be rescanned and morphologically evaluated. A high focal depth is essential in SBC measurements to acquire the fluorescence of the whole cell and to be cytometric. For tissue analysis section thickness of >30μm is needed to reduce cell sectioning leading in multiple labelled specimens to an overestimation of multiple stained cells due to stereology, mimicking co-expression or elevated expression that is in fact due to coincidences in the z-axis direction. By confocal sectioning and 3D-reconstruction these overlays could be eliminated but confocal 3D imaging is slow and the resulting data are not cytometric. To overcome this obstacle, we combined SBC analysis with confocal imaging using a Laser Scanning Cytometer (iCys, Compucyte Corp., MA). Single to triple labelled 30-120μm thick human brain sections were scanned cytometrically (up to three laser 405nm, 488nm, 633nm) and double and triple labeled cells were identified. Afterwards selected cells of interest were relocated, scanned confocally and 3D-reconstructed (Mathematica®, MathGL3d). This combination of high-throughput SBC and high-resolution confocal imaging enables for unequivocal identification of multiple labelled objects and is a prerequisite for Cytomic tissue analysis, Tissomics. (Support: HBFG 036/379-1)
Keywords: Slide Based Cytometry, Confocal imaging, Image Analysis
1. Introduction
1.1. Cytomics
Quantitative and highly multiplexed analysis of cells at the single cell level in combination with bioinformatic analysis has led to a new field called cytomics. Cytomics became of great impact during the last years. In some fields of Cytomics applying the cytometric techniques it represents the cutting edge today. All technological developments push the systemic approach of the analysis of biological specimens forward in order to improve research in clinical diagnostics and in drug discovery programs. In clinical application, cytomics opens the way to predictive medicine for individual patients. The high redundancy of molecular pathways in cell signaling, cell proliferation, or during apoptosis requires a very substantial number of investigations.
Cell systems are composed of various kinds of single cells, constituting the elementary building units of organs and organisms. The individualized analysis of single cells overcomes the problem of averaged results from cell and tissue homogenates in which molecular changes in low frequency cell populations may be wrongly interpreted. Single cells can be either uniform or confined to particular cell subpopulations that may be lost by dilution.1 This problem is out ruled by single-cell analysis of the molecular cell phenotypes resulting from genotype and exposure. The dimensionality of measured molecular cell data can be substantial, especially when many different cell populations are stained with eight2 to seventeen colors3 with subsequent restaining4 and when the spatial interrelationship within a tissue is taken into account.5-9 Traditional visual and quantitative evaluations of gated 2D or 3D cytometric histograms as in flow cytometry collect only a very limited amount of the available information, and one is never certain whether the really relevant information has been collected. Essential information may therefore be lost. As a consequence, more sophisticated multidimensional data mining techniques, rather than pattern recognition by human observers and reduction of dimensionality approaches, will be required.10-12
The methodical basis for Cytomics are cytometric technologies for their speed of analysis but, more importantly, for the feasibility to quantitate the results and standardize the analysis, making these technology GLP (Good Laboratory Praxis) compatible. Within cytometric technologies those that are based on image analysis seem to be superior to the flow-cytometry assays as (1) the samples analyzed are not lost and may be analyzed also with alternative or traditional (morphological) methods, (2) cells may be analyzed in their natural environment (tissues), and (3) detailed structural analysis within individual cells in high resolution is possible.
1.2. Tissometry and Tissomics
In analogy to cytomics tissomics is the higher ranging analysis of the entity of all cells of a given tissue (Fig. 1). In the understanding of a tissue in the tissomics sense the following predispositions need to be fulfilled:
- The cytomics analysis of individual cells within the intact tissue and
- The understanding of the interrelationship of these cells in microanatomical regions within the tissue.
Although we can observe tissues with today’s technologies in a nearly cytometric fashion by methods such as confocal microscopy,7,8 Laser Scanning Cytometry5 or Scanning Fluorescence Microscopy13 we analyze three dimensional objects in two dimensions. If we apply these technologies to quantify cellular content in single cell preparations or in single cell layer tissue cultures we will still yield cytometric information as long as the focal depth is greater than the height of the cells. In tissues, however, the situation is far more complex because cells are not located in isolated layers but over- and underlay each other.
The problem of quantifying objects in three dimensional structures has been addressed by the XIXth century French geologist Delesse14 who introduced stereology as a mathematical tool to estimate volumetric and numerical density of objects (i.e. minerals) in rocks following microscopic determination of their areal density on polished rock surfaces. Stereological methods have been adapted to biological samples and are comprehensively described by Weibel.15 The situation in tissues, as compared to rock surfaces, is far more complex. Whereas a polished rock surface is really a 2D-object, tissue sections will be 3D by their translucency. An ideal tissue section for stereology is therefore infinitely thin. Because in these sections all cells will be sliced, estimates have to be made to calculate their real volume15 and DNA content (example in,16,17) among others. In thicker sections due to the Holmes effect18 cells or cell structures will overlap and the tissue cytometric measurement will overestimate the frequency of stained cells.5 For cytomics analysis the light information of the whole cell within the tissue and therefore physical or optical sections thicker than cells are needed and novel stereological approaches have to be developed for appropriate tissometric analysis. In contrast to stereology, where the geometry of objects and their contribution to a tissue needs to be taken into account, in tissometry also the content of substances (proteins, genes etc.) within these cells has to be quantified.
A further challenge is to understand how, within the 3D network of cells, cell subtypes and cells with different states of activation interact with each other in their natural environment. These findings will open new insights into our understanding of cells in tissues and their functions and will have implications on the diagnosis of diseases and their development. To find algorithms that will provide comprehensive and clear results from tissometric data is a challenging task.16 Even if only a few cell layers are analyzed, the complexity is hardly understandable by simple observation. This obviously requires new developments in data analysis including stereological principles.
1.3. Analyses in terms of Cytomics / Proteomics
A hypothetic model for cytomic analysis of biological specimens could work as follows (Figure 2): Viable cells may be initially stained for cell functions like intracellular pH, transmembrane potentials or Ca2+ levels, followed by fixation to remove the functional stains and staining for specific extra- or intracellular constituents such as antigens, lipids or carbohydrates. After destaining, specific nucleic acids may be stained. Microscopic image capture and analysis systems using their spatial relocation capacities will increasingly permit such staining sequences. Further genomic and proteomic characterization of single cells will yield substantial input into our understanding of cell development and function in the histological context. Serial optical sectioning will permit 3D-reconstruction of the molecular morphology of cell membrane, nucleus, organelles and cytoplasm including the parameterization of 3D-shapes.11,12 Serial histological sections taking stereological aspects of tissue architecture into account9,18 will serve as basis for the standardized analysis of proximity and interaction patterns for intracellular structures like nucleus and organelles as well as for different cell types within the tissue architecture that can even include time as a parameter for 4D intravital microscopy.19, 20
1.4. The Model: Alzheimer’s Disease
Alzheimer’s disease (AD) is histopathologically characterized by a loss of synapses and neurons associated with the formation of neurofibrillary tangles and neuritic plaques. The neurodegeneration follows a certain hierarchy21 starting at the transentorhinal and entorhinal cortex, progressing to the limbic cortex and eventually reaching isocortical association areas at most advanced stages of the disease. This pattern of disease progression matches the regional degree of neuronal plasticity and inversely recapitulates ontogenetic and phylogenetic brain development.22 As a likely explanation for this selective neuronal vulnerability, it has been hypothesized that adult neurons with a high plastic potential rest in a labile state of differentiation which is prone to a loss of differentiation control and a subsequent de-differentiation which renders these neurons highly vulnerable for neurodegeneration.22,23 This hypothesis is supported by the expression of developmentally regulated genes in AD which corresponds to a condition of de-differentiation and links neurodegeneration to cell cycle related events24,25. The re-expression of a multitude of cell cycle regulators known to control the activation and progression of the cell cycle in dividing cells has been observed in degenerating neurons in AD.26-34 Moreover, applying the FISH technique to paraffin sections of the adult human CNS, Yang et al.35,36 could provide direct evidence for DNA replication in AD. At all stages of the disease, they detected a small but rather constant number of neurons in a polyploid state suggesting that about 4% of neurons complete a nearly full S phase and, because mitosis is not initiated, remain tetraploid which might be the direct cause of cell death in AD.
More recently, two groups37,38 applying FISH to sorted isolated cellular nuclei reported a constitutional aneuploidy in the normal adult human brain including triploidy and tetraploidy, corroborating cytophotometric observations made several decades ago that the DNA content of some nerve cells exceeds the diploid level.39,40,41 This kind of trisomy and tetrasomy arises at least in part through chromosome missegration during mitosis in neuronal progenitor cells and can persist into adulthood.36 Contrary to that, however, trisomic and tetrasomic cells could be the result of cell-cycle re-entry processes and subsequent partial or full DNA replication in the adult CNS which is potentially associated with neuronal death.42 We used in the experiments shown here brain section from patients with Alzheimer’s disease to demonstrate feasibility of the approach.
2. Methodology and Results
Analysis as they result from genotype and exposure of molecular phenotypes requires instrumentation that on the one hand provides high throughput measurement of individual cells and is on the other hand highly multiplexed, enabling the simultaneous acquisition of many parameters on the single cell level.
2.1 Slide Based Cytometry
Fluorescence microscopy represents a powerful technology for stoichiometric single cell based analysis in smears or tissue sections. Whereas in the past the major goal of microscopy and imaging was to produce high quality images of cells, in the last years an increasing demand for quantitative and reproducible microscopic analysis arose. This demand came mostly from the drug discovery companies but also from clinical laboratories. Slide based cytometry is an appropriate approach to fulfil this demand.43 Laser Scanning Cytometer43,44,45 were the first type of instruments to become commercially available but today several different instruments are on the market.46,47,48 Most of these slide based cytometry instruments are built around scanning fluorescence microscopes that are either equipped with a laser43 or a mercury arc lamp as the light source.46, 47 The generated images are processed by appropriate software algorithms to produce data similar to flow cytometry. Slide based cytometry systems are intended to be high throughput instruments although at present they have a lower throughput than flow cytometers by a factor of ∼10-50. These instruments allow multicolor measurements of high complexity7,44 that is comparable to or ever higher than with flow cytometers. Another major advantage over flow cytometry is that cells in adherent cell cultures and also tissues can be analyzed without prior disintegration.5,6,8,49 In addition, due to the fixed position of the cells on the slide or in the culture chamber, cells can be relocated several times and reanalyzed. Even restaining and subsequent reanalysis of each individual cell is feasible. Because by slide based cytometry a high information density on the morphological and molecular pattern of single cells can be acquired it is an ideal technology for cytomics.
2.2. Staining of brain sections
Brain slices of 20μm thickness were processed for the immunocytochemical detection of neurofilament, the neuron-specific nuclear protein and cyclin B1 stained with propidiumiodide and subjected to single cell analyses by Laser Scanning Cytometry. Free floating sections were pre-treated in 10mM citrate buffer (pH 6.0) heated by microwave and unspecific binding sites were blocked with 0.3% milk powder, 0.1% gelatine, 1% bovine serum albumin and 0.05% Tween20 in 10mM Tris-buffered saline (pH 7.4). Sections were incubated overnight at 4°C in a cocktail of primary antibodies consisting of the monoclonal mouse-anti-neuron-specific nuclear protein (NeuN, Chemicon, 1:500), and the polyclonal rabbit-anti-cyclin B1 (clone H-433, Santa Cruz, 1:500) in blocking solution. Bound primary monoclonal antibodies were detected by secondary Cy5-conjugated goat-anti-mouse antibody (Dianova, 1:300) while the polyclonal antibody signal was amplified by a secondary system consisting of a biotinylated donkey-anti-rabbit antibody (Amersham, 1:1000), the TSA Biotin System (Perkin Elmer Life Sciences) and a Cy2-conjugated Streptavidin (Dianova, 1:500). Subsequently, free floating sections were treated with 50μg/ml propidiumiodide (PI) in Tris buffered saline containing 100μg/ml Ribonuclease A (Sigma) for 30min at 37°C. Sections were mounted onto slides using DAKO® fluorescent mounting medium.
2.3. Analysis by Slide based Cytometry
The fluorescent dyes Cy2 and PI were excited by the 488nm line of the Argon laser, Cy5 was excited by the 633nm line of the Helium-Neon laser with an iCys Laser Scanning Cytometer (CompuCyte Corporation, Cambridge, MA, USA). The PI signal was used as triggering signal for cell detection and the fluorescences of Cy2 and Cy5 were recorded within the triggering contour of each event. For data acquisition the iCys software was used. Each fluorescent event was recorded with respect to size, perimeter, x-y position on the object slide and maximum and average intensity. During analysis a first window was created, showing the area of each fluorescent event versus the associated PI integral (Fig. 3A). In this window a gate was set to exclude doublets and the singlets were gated into a second window (PI Max Pixel versus PI Integral, Fig. 3B). Through this protocol, doublets, artifacts and cell debris were excluded from the analysis. For the analysis of the NeuN (Cy5) and the cyclin B1 (Cy2) signal, cells were gated into a dotplot showing the Cy2 Max Pixel versus the Cy5 Max Pixel (Fig. 3C). Gates were defined by measurements of specimen omitting the primary antibodies. The cells of each region were now gated separately into a window with the histogram of the PI Integral (Fig. 3D-G).
2.4. 3D reconstruction of parts of interest of a previously analysed brain section
To verify suspect data or to increase information of interesting cells respectively images of the analysed section were acquired every 1μm with the confocal unit of the iCys. Due to limitations of the camera set up only fluorescences of PI and Cy2 could be obtained after excitation with the 488nm Argon laser. In every focus level two images were taken. One image comprised the information of PI using a 625/25nm filter. The other images was acquired with a 530/30nm filter for obtaining the fluorescence of Cy2. These images were taken to reconstruct the section in 3D with MathGL3d (Mathematica®).
3. Discussion and Conclusion
For cytomics analyses fluorescence information of the whole cell within tissue or cell cultures is needed. This is only possible if the fluorescence of stained cells is taken from a wider focus range unlike to confocal microscopy. Due to the Holmes effect this means in analysis of tissue sections that fluorescence signals can not only be the result of a stained single cell but also a side effect of over or underlying cells. Hence, confocal scanning of suspected cells is an ideal complement to cytometric analysis. With these images generated by confocal scanning and 3D maps of the images it can be verified whether fluorescences derive from the expected cell, its cytoplasm or nuclei or from a different cell. This method increases information of biological specimen at the single cell level and also the understanding of the interrelationship of these cells within the tissue.
Although at present not realized, the information density per cell can be even more increased by implementing technologies such as spectral imaging,8 confocal cytometry,50 fluorescence resonance energy transfer (FRET),8,51,52 near infrared Raman spectroscopy,53 fluorescence lifetime imaging (FLIM)52,54 and second harmonic imaging,55 and optical coherence tomography.56 All of these technologies mark the progress in optical bioimaging. In future, limit braking developments in imaging resulting from a family of concepts that allows image acquisition far beyond the resolution limit down to the nm-range are expected. These include multiphoton excitation,57 ultra sensitive fluorescence microscopes,58 stimulated emission depletion (STED) microscopy,59 spectral distance microscopy,60 atomic force microscopy (AFM) and scanning near-field optical microscopy (SNOM)61 and image restoration techniques.62 Using laser ablation in combination with imaging even thick tissue specimens can be analyzed on a cell by cell bases.63
4. Acknowledgement
This work was partially supported by the German Research Association, DFG, 2006 (HBFG-036/379-1).
Parts of this work were presented (Abstract #6441-16) at the conference “Photonics West: Biomedical Optics,” San Jose, California, USA, 20 – 25 January 2007
References
- P. Szaniszlo, N. Wang, M. Sinha, L.M. Reece, J.W. Van Hook, B.A. Luxon, and J.F. Leary, “Getting the right cells to the array: Gene expression microarray analysis of cell mixtures and sorted cells,” Cytometry A, 59A(2), 191-202 (2004).
- A. Mittag, D. Lenz, A.O. Gerstner, U. Sack, M. Steinbrecher, M. Koksch, A. Raffael, J. Bocsi and A. Tarnok. “Polychromatic (eight-color) slide-based cytometry for the phenotyping of leukocyte, NK, and NKT subsets”, Cytometry A, 65A(2), 103-15 (2005).
- S.P. Perfetto, P.K. Chattopadhyay and M. Roederer, “Seventeen-colour flow cytometry: unravelling the immune system”, Nat Rev Immunol, 4(8), 648-55 (2004).
- W. Laffers, A. Mittag, D. Lenz, A. Tárnok and A.O.H. Gerstner, “Iterative re-staining as a pivotal tool for n-color immunophenotyping by slide-based cytometry”, Cytometry Part A, 69A(7):691-703 (2006).
- A.O. Gerstner, C. Trumpfheller, P. Racz, P. Osmancik, K. Tenner-Racz and A. Tarnok, “Quantitative histology by multicolor slide-based cytometry”, Cytometry A, 59(2), 210-219 (2004).
- J. Smolle, A. Gerger, W. Weger, H. Kutzner and M. Tronnier, “Tissue counter analysis of histologic sections of melanoma: Influence of mask size and shape, feature selection, statistical methods and tissue preparation”, Anal Cell Pathol, 24, 59-67 (2002).
- R.C. Ecker and G.E. Steiner, “Microscopy-based multicolor tissue cytometry at the single-cell level”, Cytometry, 59A, 182-190 (2004).
- R.C. Ecker, R. De Martin, G.E. Steiner and J.A. Schmid, “Application of spectral imaging microscopy in cytomics and fluorescence resonance energy transfer (FRET) analysis”, Cytometry, 59A, 172-181 (2004).
- R.C. Ecker and A. Tarnok, “Cytomics goes 3D: toward tissomics”, Cytometry A, 65(1), 1-3 (2005).
- A. Kriete and K. Boyce, “Automated tissue analysis – a bioinformatics perspective”, Methods Inf Med. 44(1), 32-37 (2005).
- T. Zhao, M. Velliste, M.V. Boland and R.F. Murphy, “Object type recognition for automated analysis of protein subcellular location”, IEEE Trans Image Process, 14(9), 1351-1359 (2005).
- X. Chen and R.F. Murphy, “Objective clustering of proteins based on subcellular location patterns”, J Biomed Biotechnol, 2005(2), 87-95 (2005).
- V. S. Varga, J. Bocsi, F. Sipos, G. Csendes, Z. Tulassay and B. Molnar, “Scanning fluorescent microscopy with digital slide and microscope is an alternative for quantitative fluorescent cell analysis,” Cytometry. 60A, 53-62 (2004).
- M. A. Delesse, “Procédé mécanique pour determiner la composition des roches.” C. R. Acad. Sci. Paris. 25, 544-545 (1874).
- E. R. Weibel, “Stereological Methods. Practical methods for biological morphometry,” Academic Press, London (1979).
- T. Irinopoulou, J. Vassy, M. Beil, P. Nicolopoulou, D. Encaoua and J. P. Rigaut, “Three-dimensional DNA image cytometry by confocal scanning laser microscopy in thick tissue blocks of prostatic lesions,” Cytometry. 27, 99-105 (1997).
- U. Jütting, P. Gais, K. Rodenacker, J. Böhm and H. Höfler, “MIB-1, AgNOR and DNA distribution parameters and their prognostic value in neuroendocrine tumors of the lung,” Image Anal. Stereol. 19, 39-43 (2000).
- C.A. Mandarim-de-Lacerda, “Stereological tools in biomedical research”, An Acad Bras Cienc, 75, 469-486 (2003).
- T.R. Mempel, S.E. Henrickson and U.H. Von Andrian, “T-cell priming by dendritic cells in lymph nodes occurs in three distinct phases”, Nature, 427, 154-159 (2004).
- H. Schmidt, B. Schwaller, and J. Eilers, “Calbindin D28k targets myo-inositol monophosphatase in spines and dendrites of cerebellar Purkinje neurons.”, Proc Natl Acad Sci USA. 102(16), 5850-5855 (2005).
- Braak H, Braak E (1991) Neuropathological stageing of Alzheimer-related changes. Acta Neuropathol (Berl) 82:239-259.
- Arendt T (2001) Alzheimer’s disease as a disorder of mechanisms underlying structural brain self-organization. Neuroscience 102:723-765.
- Arendt T, (1993) Neuronal dedifferentiation and degeneration in Alzheimer’s disease. Biol. Chem. Hoppe-Seyler 374:911-912.
- Heintz N (1993) Cell death and the cell cycle: a relationship between transformation and neurodegeneration? Trends Biochem Sci 18:157-159.
- Arendt T, Holzer M, Stobe A, Gartner U, Luth HJ, Bruckner MK, Ueberham U (2000) Activated mitogenic signaling induces a process of dedifferentiation in Alzheimer’s disease that eventually results in cell death. Ann N Y Acad Sci 920:249-255.
- Arendt T, Rodel L, Gartner U, Holzer M (1996) Expression of the cyclin-dependent kinase inhibitor p16 in Alzheimer’s disease. Neuroreport 7:3047-3049.
- Arendt T, Holzer M, Gartner U (1998) Neuronal expression of cycline dependent kinase inhibitors of the INK4 family in Alzheimer’s disease. J Neural Transm 105:949-960.
- Busser J, Geldmacher DS, Herrup K (1998) Ectopic cell cycle proteins predict the sites of neuronal cell death in Alzheimer’s disease brain. J Neurosci 18:2801-2807.
- McShea A, Harris PL, Webster KR, Wahl AF, Smith MA (1997) Abnormal expression of the cell cycle regulators P16 and CDK4 in Alzheimer’s disease. Am J Pathol 150:1933-1939.
- Nagy Z, Esiri MM, Cato AM, Smith AD (1997a) Cell cycle markers in the hippocampus in Alzheimer’s disease. Acta Neuropathol (Berl) 94:6-15.
- Nagy Z, Esiri MM, Smith AD (1997b) Expression of cell division markers in the hippocampus in Alzheimer’s disease and other neurodegenerative conditions. Acta Neuropathol (Berl) 93:294-300.
- Smith TW, Lippa CF (1995) Ki-67 immunoreactivity in Alzheimer’s disease and other neurodegenerative disorders. J Neuropathol Exp Neurol 54:297-303.
- Vincent I, Jicha G, Rosado M, Dickson DW (1997) Aberrant expression of mitotic cdc2/cyclin B1 kinase in degenerating neurons of Alzheimer’s disease brain. J Neurosci 17:3588-3598.
- Ding XL, Husseman J, Tomashevski A, Nochlin D, Jin LW, Vincent I (2000) The cell cycle Cdc25A tyrosine phosphatase is activated in degenerating postmitotic neurons in Alzheimer’s disease. Am J Pathol 157:1983-1990.
- Yang Y, Geldmacher DS, Herrup K (2001) DNA replication precedes neuronal cell death in Alzheimer’s disease. J Neurosci 21:2661-2668.
- Yang Y, Mufson EJ, Herrup K (2003) Neuronal cell death is preceded by cell cycle events at all stages of Alzheimer’s disease. J Neurosci 23:2557-2563.
- Rehen SK, Yung YC, McCreight MP, Kaushal D, Yang AH, Almeida BS, Kingsbury MA, Cabral KM, McConnell MJ, Anliker B, Fontanoz M, Chun J (2005) Constitutional aneuploidy in the normal human brain. J Neurosci 25:2176-2180.
- Yurov YB, Iourov IY, Monakhov VV, Soloviev IV, Vostrikov VM, Vorsanova SG (2005) The variation of aneuploidy frequency in the developing and adult human brain revealed by an interphase FISH study. J Histochem Cytochem 53:385-390.
- Brodskij VJ, Kusc AA (1962) Izmenenie cisla polyploidnych kletok v postembryonalom razvitiji tkanej krysy. Dokl Akad Nauk SSSR Otd Biol 162:713-716.
- Lapham LW, Johnstone MA (1963) Cytologic and cytochemical studies of neuroglia. Arch Neurol 9:194-202.
- Mares V, Lodin Z, Sacha J (1973) A cytochemical and autoradiographic study of nuclear DNA in mouse Purkinje cells. Brain Res 53:273-289.
- Herrup K, Arendt T (2002) Re-expression of cell cycle proteins induces neuronal cell death during Alzheimer’s disease. J Alzheimers Dis 4:243-247.
- A. Tarnok and A. Gerstner, “Clinical applications of laser scanning cytometry,” Cytometry (Clinical Cytometry), 50, 133-143 (2002).
- A. Gerstner, D. Lenz, W. Laffers, R. Hoffmann, M. Steinbrecher, F. Bootz, and A. Tarnok, “Near-Infrared Dyes for six-color immunophenotyping by Laser-Scanning-Cytometry”, Cytometry, 48, 115-123 (2002).
- S.G. Megason and S.E. Fraser, “Digitizing life at the level of a cell: high-performance laser-scanning microscopy and image analysis for in toto imaging of development”, Mechanisms Development; 120, 1407-1420 (2003).
- S. Bajaj, J.B. Welsh, R.C. Leif and J.H. Price, “Ultra-rare-event detection performance of a custom scanning cytometer on a model preparation of fetal nRBCs,” Cytometry, 39, 285-294 (2000).
- B. Molnar, L. Berczi and C. Diczhazy, A. Tagscherer, S.V. Varga, B. Szende, and Z. Tulassay, “Digital slide and virtual microscopy based routine and telepathology evaluation of routine gastrointestinal biopsy specimens,” J Clin Pathol, 56, 433-438 (2003).
- E. Luther, L. Kamentsky, M. Henriksen and E. Holden., “Next-generation laser scanning cytometry”, Methods Cell Biol, 75, 185-218 (2004).
- A. Kriete, M.K. Anderson, B. Love, J. Freund, J.J. Caffrey, M.B. Young, T.J. Sendera, S.R. Magnuson, and J.M. Braughler, “Combined histomorphometric and gene-expression profiling applied to toxicology.”, Genome Biol. 4(5), R32 (2003).
- J. Pawley (Ed.), “Handbook of Biological Confocal Microscopy”, 2nd Edition, Plenum Press, New York (1995).
- E.A. Jares-Erijman and T.A. Jovin, “FRET imaging”, Nature Biotechnol, 21, 1387-1395 (2003).
- M. Peter and S.M. Ameer-Beg, “Imaging molecular interactions by multiphoton FLIM”, Biol Cell., 96, 231-236 (2004).
- P. Crow, J.S. Uff, J.A. Farmer, M.P. Wright and N. Stone, “The use of Raman spectroscopy to identify and characterize transitional cell carcinoma in vitro”, BJU Int, 93, 1232-1236 (2004).
- S. Murata, P. Herman, H.J. Lin and J.R. Lakowicz, “Fluorescence Lifetime Imaging of Nuclear DNA: Effect of Fluorescence Resonance Energy Transfer, Cytometry, 41, 178-185 (2000).
- P.J. Campagnola and L.M Loew, “Second-harmonic imaging microscopy for visualizing biomolecular arrays in cells, tissues and organisms”, Nature Biotech, 21, 1356-1360 (2003).
- J.G. Fujimoto, “Optical coherence tomography for ultrahigh resolution in vivo imaging.”, Nat Biotechnol. 21(11), 1361-1367 (2003).
- F. Manconi, E. Kable, G. Cox, R. Markham and L.S. Fraser, “Whole-mount sections displaying microvascular and glandular structures in human uterus using multiphoton excitation microscopy”, Micron, 34, 351-358 (2003).
- J. Hesse, M. Sonnleitner and G.J. Schutz, “Ultra-sensitive fluorescence reader for bioanalysis”, Curr Pharm Biotechnol., 5, 309-319 (2004).
- S.W. Hell, “Towards fluorescence nanoscopy”, Nature Biotech, 21, 1347-1355 (2003).
- A. Esa, P. Edelmann and G. Kreth et al, “Three-dimensional spectral precision distance microscopy of chromatin nanostructures after triple-colour DNA labelling: a study of the BCR region on chromosome 22 and the Philadelphia chromosome”, J Microsc, 199, 96-105 (2000).
- S. Rieti, V. Manni, A. Lisi, L. Giuliani, D. Sacco, E. D’Emilia, A. Cricenti, R. Generosi, M. Luce and S. Grimaldi, “SNOM and AFM microscopy techniques to study the effect of non-ionizing radiation on the morphological and biochemical properties of human keratinocytes cell line (HaCaT) “, J Microsc, 213, 20-28 (2004).
- T.J. Holmes and Y.H. Liu, “Image Restoration for 2-D and 3-D Fluorescence Microscopy”,. In Visualization in Biomedical Microscopies 3-D Imaging and Computer Applications, Kriete A, Ed., 283-323, VCH-Publisher, Weinheim (1992).
- P.S. Tsai, B. Friedman and A.I. Ifarraguerri et al., “All-optical histology using ultrashort laser pulses”, Neuron., 39, 27-41 (2003).
- H.V. Westerhoff, “The silicon cell, not dead but live!” Metab. Eng. 3, 207-210 (2001).
Figures
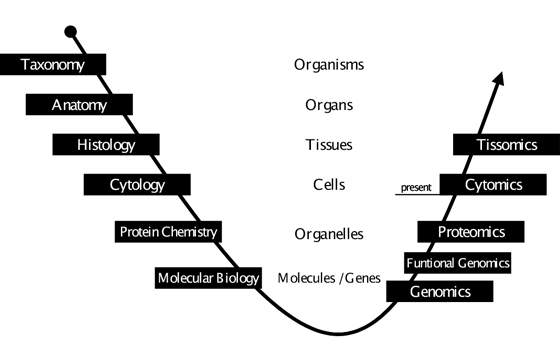
Figure 1: Analysis of the Biocomplexity. Throughout the course of time there has been an evolution of scientific disciplines in biology and medicine, which look at different aspects of life. Starting at the level of the entire organism, over time ever-smaller structures have come into focus and ever more detailed questions have been asked. With the availability of high throughput techniques in gene technology and the advent of (molecular) bioinformatics a turning point was reached at the level of genes, the molecular basis of life. The frontiers of research were extended from structures and details to entities and totalities, with genomics becoming the first in a growing series of “-omics” disciplines. Functional genomics and proteomics are far from being completed, yet cytomics already constitutes itself as a scientific discipline. At each level of complexity we will have to face overwhelming amounts of data – and at the same time we will have to deal with changing principles of interrelation and different laws of nature. Therefore it is compulsory that each omics-discipline will need a specialized sub-discipline of bioinformatics. This is what currently happens at the cellular level. We are witnessing the emergence of cytomics as a biomedical science and cellular bioinformatics as the complement in computational science (for an in-depth-view on cellular bioinformatics refer to64). It is this co-evolution of disciplines which has created the most significant progress in science ever. Consequently the question is not whether there will be something beyond cytomics – dealing with even higher organizational levels – but rather what name it will be given and when it will emerge; we suggest tissomics. (Figure modified after Ecker RC, TissueGnostics GmbH, Vienna, Austria)
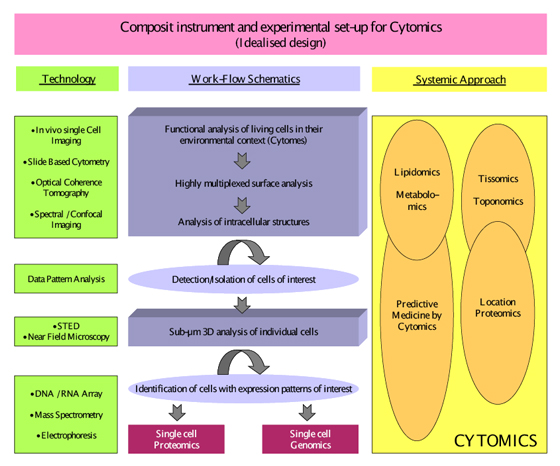
Figure modified after Tarnok A. Cytometry Part A, 69A: 555-562. 2006, with permission from the publisher
Figure 2: Idealized hypothetical design of a composite slide based cytometry instrument and an experimental set-up for Cytomics analysis of cells.
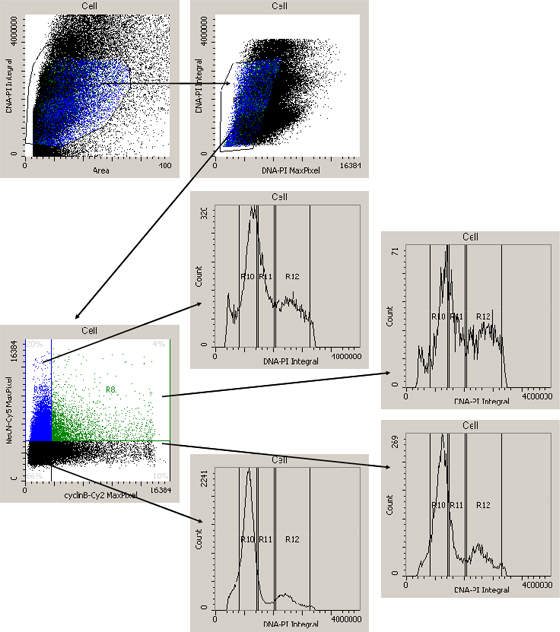
Figure 3: Acquisition of cytometric data. (A & B) Gating cascade to exclude doublets, cell debris and artifacts. (C) Display of the Cy2 and Cy5 fluorescence marking cyclin B1 and NeuN signals. 20.0% of the cells show only Cy5 (NeuN) fluorescence, 10% only Cy2 (cyclin B1) fluorescence, 4% of the cells were double-labelled and 66% were neither NeuN-positive, nor cyclin B1-positive. (D-G) PI-histogram as performed for each cell population
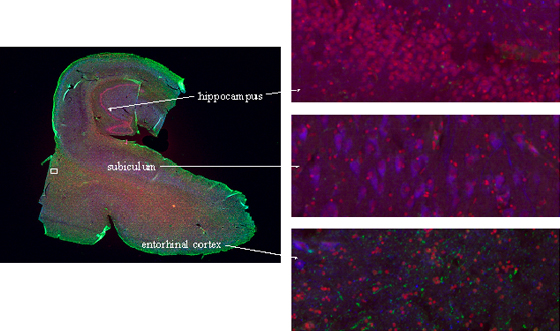
Figure 4: Compucolor image of a brain section stained with PI (red), cyclinB-Cy2 (green), and NeuN-Cy5 (blue). Different brain regions could easily be differentiated by images generated during analysis. A small area of the section from the entorhinal cortex (white rectangle) was scanned confocally after analysis and reconstructed in 3D (see figure 5).
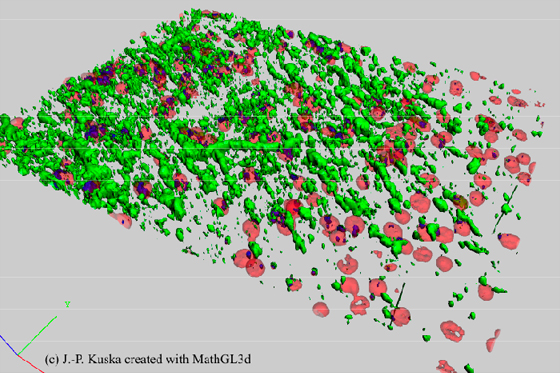
Figure 5: 3D reconstructed cytometric data. Confocal images with the information of PI (red) and cyclinB-Cy2 (green) were used to create this virtual map of a part of the netorhinal cortex of a brain section (see also figure 4). This map can be used to verify whether cyclinB is located within a nuclei (blue) or not.
Endnotes
- a Pediatric Cardiology, Cardiac Center Leipzig GmbH, University of Leipzig, Leipzig, Germany
- b Translational Center for Regenerative Medicine (TRM-Leipzig), University of Leipzig, Germany
- c Interdisciplinary Centre for Bioinformatics, University of Leipzig, Germany
- d Institute of Radiopharmacy, Department of Radiopharmaceutical Biology, Research Center Dresden-Rossendorf, Dresden, Germany
- e Paul Flechsig Institute of Brain Research, Department of Neuroanatomy University of Leipzig, Leipzig, Germany
Further author information:
- Prof. Dr.rer nat. Attila Tárnok
- Ass. Prof., Laboratory Director
- Dept. of Pediatric Cardiology
- Cardiac Center Leipzig
- University of Leipzig
- Strümpellstr. 39 D-04289 Leipzig, Germany
- Phone: +49-341-8652430
- Fax: +49-341-8651143
- E-Mail: tarnok@medizin.uni-leipzig.de