
- Home
- Seminal Contributions
- Cytometry History
- Research Centers
- Photo & Video
- Cytometry and Society
- Education & Research
- Sponsors
Home Education & Research Flow Analysis


Flow Cytometric Analysis of In Vitro Proliferation and Immunosuppression by Fluorescent Dyes that are Successively Dispersed upon Cell Division
Techniques and caveats
by Markus Biburger Ph.D. and Annette Erhardt
Introduction
In the majority of publications dealing with lymphocyte proliferation and also suppression of proliferation in cocultures with immunoregulatory cell types, this proliferation is quantified by incorporation of radioactive [3H] thymidine.
However, this method is only a “snapshot” of DNA synthesis within the last hours of the experiment after [3H] thymidine had been added.
This means that one has no valid information about what had been going on in the assay prior to [3H] thymidine supplementation. In theory, you might measure the same radioactivity in two samples where in Sample A proliferation had been suppressed in the beginning of the experiment and now in the “thymidine incorporation phase” a small number of cells have started to vigorously synthesize DNA and Sample B had experienced proliferation in the beginning and now cells had stopped to proliferate due to medium exhaustion. This also means that you have no measurement of any cell numbers but only on the over-all DNA synthesis. In addition, in any kind of coculture experiments it is mostly important, to exclude thymidine incorporation by the no-responder cells (e.g. suppressor cells). This is often achieved by radiating these cells to disable their capability for cell division. However, there is always a chance that this treatment also affects several other functions of these cells, that might influence their performance in the assay.
In contrast to the constraints of [3H] thymidine incorporation, when analyzing cells labelled with fluorescent compounds like CFSE or PKH26, which are equally passed on to the daughter cells upon cell division (Fig. 1), at the end of the experiment you have kind of a “diary,” enumerating every cell division having taken place during the entire experiment.
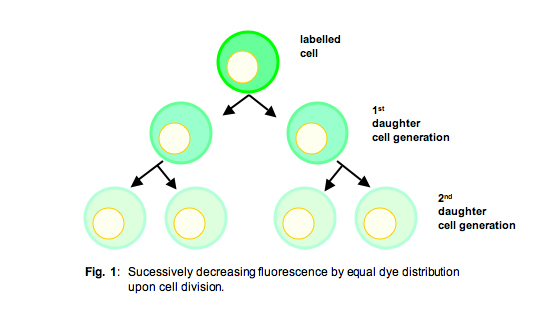
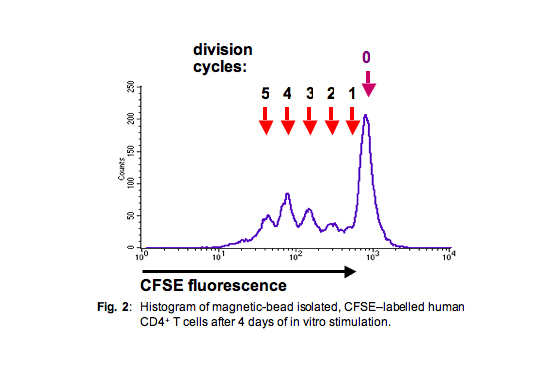
Since the amount of these fluorescent dyes on each cell corresponds to ± exactly one-half of the amount of the respective progenitor cells from the preceding generation, one can gain a histogram with rather sharp peaks corresponding to the entirety of cells from any respective generation (Fig. 2), provided that the cell population was rather homogenous.
Techniques
1. Staining
Staining protocols for these kinds of fluorescent dyes like CFSE and PKH26 are rather simple and not very time consuming. Important points for optimal quantification of cell division are i) high quality and homogeneity of the cells you want to label, ii) minimization of protein content in the cell suspension during the labeling (no or low amounts of fetal calf serum or BSA!) iii) adequate neutralization of unbound dye (e.g. by fetal calf serum) thereafter, iv) extensive washing. Since very high numbers of cells can easily be stained with rather low amounts of dye, it is reasonable to label as many cells as possible, since you may loose a significant percentage during the washing steps in large volume. We found that the staining kits that are available from different companies and contain all necessary compounds at optimized concentrations reveal good staining results rather consistently, whereas performance of staining with self-made solutions from separately purchased compounds is more variable.
In the appendix we describe two short protocols for CFSE staining and PKH26 staining, based on two commercially available staining kits that worked well in our hands.
2. Activation
We found that results from thymidine incorporation achieved with any given stimulus do not necessarily give comparable results with the FACS-based method. This may be due to the fact that with the incorporation method one can have thousands of cpm without observing any changes in the cell number, since only DNA synthesis is detected (see above). Thus before doing any important experiments, one should test several stimuli (different compounds and different concentrations) to define possible conditions for good proliferation detection. In our hands e.g. anti-CD3/anti-CD28 coated T-cell proliferation beads gave the best results for human CD4 T cells.
3. Quantification
There are several programs around (some of them already within the software packages coming with up-to-date cytometers) that allow easy calculation of the percentage of any given generation within the total cell population. If you don’t have such a program, you could present your results in two ways:
- the percentage of cells within the total population that have divided at least once (by simply gating on all responder cells except for the “generation 0” peak.
- a proliferative index (PI). We have developed that algorithm behind what we describe as PI in our laboratory, but, since it is not top-level mathematics, many others may have developed this – or a similar algorithm – before:
- proliferative index (PI)
- PI=Log[FInd/MFIall]/Log[2]
- with MFIall=median fluorescence intensity of all viable T cells and FInd=peak fluorescence intensity of the viable non-divided cells This PI is a mathematic approximation to the median number of divisions, the cells in a given population have passed through since the timepoint of CFSE or PKH-26 staining.
Caveats for co-culture expression experiments
In principle, one could carry out suppression experiment using fluorescently labeled responder cells e.g. CD4+ CD25- T helper cells in presence or absence of un-labeled suppressor cells like e.g. CD4+ CD25+ regulatory T-cells. However, there are a number of caveats with these approaches:
1. “Bleeding” of fluorescent dye from responder cells.
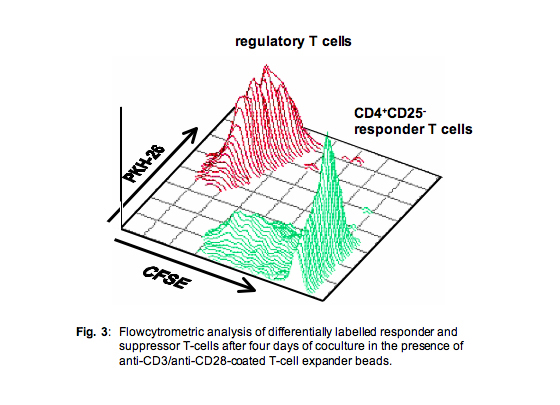
It is a well known fact that even with extensive washing of the responder cells after the labeling procedure, within the first day of culture, some of the dye is “bleeding” from the cells. This does only marginally affect the analysis of the responder cells, we found that this released dye can significantly stain the – previously undyed – suppressor cells. Thus, in initial experiments with this setting, we found the low fluorescence of the undesirably labeled regulatory cells to overlap with the fluorescence of responder cells that had passed through multiple cell divisions. In such experiments analysis of responder cell proliferation was rendered impossible.
In order to solve this problem we then routinely stained both the responder cells (typically with CFSE) and the suppressor cells (typically with PKH26).
This approach enabled perfect discrimination between both populations and revealed additional information also on the proliferative capacity of the suppressor cell population (Fig. 3)
2. “Suppression by cell number”
We repeatedly found that apparent “suppression” with regard to reduced proliferation of responder cells can be found by addition of any cell type to the assay. i.e. proliferation is not only reduced if you add suppressor cells to the assay, but often also if you add for example non-labeled responder cells to the labeled responder cells. This means that under some circumstances not only the ratio of responder to suppressor cells is important, but also the total number of cells. This effect might be based on medium exhaustion or numbers of cell-cell contacts. Thus, to be sure that one describes actual suppressive features of the regulatory cell type of interest, one should use two controls: 1) responder cells alone in the same amount as in the coculture with the suppressor cells, and 2) responder cells plus non-suppressive cells to reach the total cell number like in the coculture with the suppressor cells. These non-suppressive cells should of course resemble as much as possible to the suppressor cell type of interest.
E.g. upon analysis of effects of CD4+ CD25+ T cells on CD4+ CD25- T cells one might use a scheme like:
- 105 CD4+ CD25-
- 105 CD4+ CD25- cells + 105 CD4+ CD25+ Tregs
- 105 CD4+ CD25- cells + 105 CD4+ CD25- cells
For additional responder to suppressor ration e.g. additionally:
- 105 CD4+ CD25- cells + 5 × 10⁴ CD4+ CD25+ Tregs
- 105 CD4+ CD25- cells + 5 × 10⁴ CD4+ CD25- cells
Appendix
Labelling of T cells with CFSE
- Prepare a CFSE stock solution of 5μM in PBS from the DMSO stock
- Determine cell number
- Adjust cells to 2 x 10⁷ cells/ml in PBS
- Mix an equal amount of cell suspension with the CFSE stock solution
- Incubate for 15min at room temperature
- Mix with half the amount of FCS to quenche unbound CFSE
- Fill the labelling tube with icecold PBS
- Centrifuge for 5 min at 12000 rpm, and discard supernatant
- Repeat washing step
Labelling of T cells with PKH26
- Determine cell number
- Adjust cells to 1 x 10⁷ cells/ml
- Centrifuge for 5 min at 400 x g, and discard supernatant
- Add 1ml of Diluent C and resuspend cells
- Prior to staining prepare a PKH26 stock solution of 4μM in Diluent C
- Add the 1ml cell suspension with 1ml dye solution (PKH26 working solution 2μM)
- Mix gently
- Incubate at room temperature for 5 min
- Stop the reaction by adding an equal amount of FCS and incubate for 1 min
- Add an equal volume of complete medium
- Centrifuge for 10 min at 400 × g, and discard supernatant
- Repeat the washing step with 10ml complete medium

- Markus Biburger Ph.D. and Annette Erhardt
- Inst. for Experimental and Clinical Pharmacology and Toxicology
- University of Erlangen Nuremberg