Main MenuOn-Line CatalogTechnical LibraryFields of InterestWhat's NewOn-line OrderingSigma Service

No More Limitations

Traditional cell proliferation assays using radiolabeled (3H) thymidine to measure DNA synthesis provide only an estimate of the total cell population’s potential to divide. Radiolabeling techniques do not allow for analysis of the differential responses among phenotypically distinct subsets in a heterogeneous cell population. In some methods, individual populations of cells are tediously separated. However, complete cell separation is rarely achieved. These methods do not allow for studies that require interaction between phenotypically different cells.

An alternative model using 3-(4,5-dimethylthiazol-2-yl)-2, 5-diphenyltetrazolium bromide (MTT) as a dye provides a more accurate reflection of proliferating activity,1-6 but suffers from the inability to distinguish the proliferative activities of subsets of cells within the total population.

The Cell Census PlusTM System overcomes these limitations.

METHOD COMPARISON
CCPSFI3H-TdRMTTCOUNT
Total
Populationyesyesyesyesyes
Subset
Identityyesyesnonono
Number of Cell Divisionsyesnononono
Generations as a % of Totalyesnononono
Chronologyyesnononono

CCPSProliferation Index determined using the Cell Census Plus System.
FIFluorescence Index (Ratio of MFI at time zero to MFI at time t).
3H-TdRTritiated-thymidine incorporation.
MTTDye conversion, measured at A540.
CountDirect cell counts, e.g. using hemocytometers or particle counters based on Coulter principle.

Sample
ID
3H-Thymidine
(CPM)
CCPS
(PI) (PP)
1117,7513.446.9
385,5683.484.0
457,9593.862.7
558,6143.742.9
657,7013.375.1
797,9993.775.9
891,1453.224.5
9121,9533.688.1
1095,4684.498.7
11131,2813.384.5
13125,7694.366.8
r*1.000 0.10380.6129
p*0.7610.045
Table 1.
Human peripheral blood mononuclear cells from 11 normal donors were labeled with 2 µM PKH26 dye. An aliquot of each was fixed and saved for analysis as the day zero control. The rest of the labeled cells were placed in culture with 3 µg/ml PHA for 4 days. For the 3H-thymidine assay, aliquots of cultures were removed on day 4 and pulsed overnight. The data is given as CPM incorporated. The background incorporation in cultures incubated with media alone was uniformly less than 2,000 CPM for all donors. An aliquot of cultured cells from each donor was removed for measurement of proliferation by PKH26 fluorescence using flow cytometry. The flow cytometry data is presented as proliferation index (PI) calculated using Cell Census Plus and proliferation potential (PP).7

  • Correlation to the results obtained by the mitogenic assays (cpm) was analized by Pearsan’s Correlation Analysis Method
    r=correlation p=probability

(Data contributed by Y. Yamamura, Ph.D., Ponce School of Medicine, Puerto Rico.)
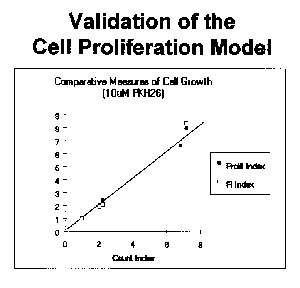
Figure 2.
Correlation of the measurement of cell proliferation using PKH26 dye and cell counts. The data from Figure 3 was presented in a correlation plot as Proliferation Index (PI), calculated by Cell Census Plus, and as Fluorescence Index [Mean Channel Fluorescence (MFI) of time zero control over MFI of given time] versus cell count. This figure clearly shows good agreement with cell counts (the most basic measurement of cell division) whether the data was presented as fluorescence measurement or the PI derived in Cell Census Plus. (Data contributed by K. Muirhead, Ph.D., Zynaxis and A. Schwartz, Ph.D., Flow Cytometry Standards Corp.)

Return to PKH Home Page

(continue)


| Main Menu | Online Catalog | Technical Library | Fields of Interest |
|
What's New | On-line Ordering | Sigma Service | Site Index |

Sigma