      
|
|
|
Saturation staining is neither necessary nor desirable in Cell Census Plus. Incorporate only enough dye to generate a brightly fluorescent peak with low CV at time zero. Over-labeling of the cells can generate a loss of membrane integrity, compromise cell recovery and biological function.
A titration optimization for each cell type to be labeled should be performed. For example, a final dye concentration of 2 ´M for 5 x 10⁶ cells in 2 ml is sufficient for human peripheral blood leukocytes and most mouse cell lines.
Harvest cultured cells and tag with selected fluorochrome conjugated antibody reagents by performing standard immunophenotyping protocols. Using flow cytometry, the cells of interest are analyzed by gating for the phenotype defined by the antibody. Any overlap in emission spectra between PKH26 and FITC or Quantum RedTM fluorophores can be satisfactorily eliminated or compensated (Figures 5a, 5b, 5c).
To add quantitative strength to the results, use the PKH26 reference microbeads to standardize setup of the flow cytometer. Use of these microbeads ensures identical parameters for all assays. PKH26 reference beads are also used to normalize cell counts.
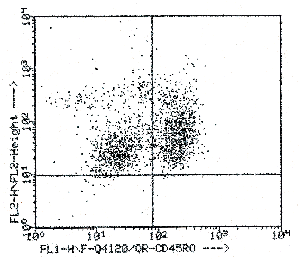 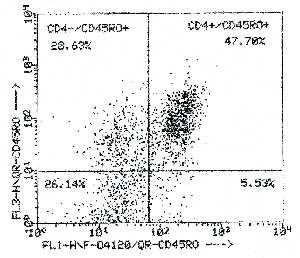
Figure 5a, 5b, 5c. |
PKH26 labeled cells have a characteristic fluorescent intensity at time zero. Cell Census Plus assumes fluorescent intensity will reduce by half at each cell division.
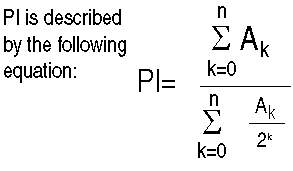
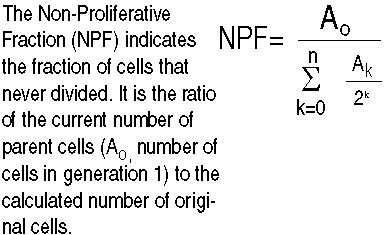
ModFit and The Cell Proliferation Model program can deconvolute histograms for up to ten generations and give the following numerical values.
ModFit and The Cell Proliferation Model program can deconvolute histograms for up to ten generations and give the following numerical values.
 |  |
The Simple.mod version of the model assigns the same standard deviation value to all generations.
The Complex.mod version of the model estimates for asymmetrical cell divisions, resulting in widening CV in successive generations.
The standard deviation of initial distribution depends on the uniformity of cell size and the uptake of dye.
| Main Menu
| Online
Catalog | Technical Library
| Fields
of Interest |
| What's
New | On-line Ordering
| Sigma
Service | Site Index
|
![]()