      
|
|
|
Day 4, CPM (SD) | ||||
|---|---|---|---|---|
| PKH26 conc. | PHA Ág/ml | |||
| 0 | 0.5 | 2.5 | 10 | |
| 4 ÁM | 103.0 (11) | 30,892 (3,102) | 48,335 (2,902) | 49,189 (1,006) |
| 2 ÁM | 138.0 (38) | 44,286 (6,458) | 52,358 (4,633) | 70,527 (1,964) |
| 1 ÁM | 99.0 (37) | 36,861 (4,138) | 54,736 (1,088) | 60,726 (1,114) |
| 0.5 ÁM | 89.0 (16) | 34,168 (3,363) | 45,705 (1,453) | 66,659 (4,658) |
| 0.25 ÁM | 75.0 (18) | 44,881 (3,588) | 60,149 (3,062) | 73,179 (2,415) |
| 0 ÁM | 215.3 (100.8) | 38,913 (4,330) | 57,231 (4,578) | 92,864 (3,439) |
|
Table 2. Human peripheral blood mononuclear cells were stained with different concentrations of PKH26 dye. Aliquots of the untreated and labeled cells were cultured with different concentrations of PHA. On Day 4, cultures were pulsed for 4 hours with 3H-thymidine. Each number represents the average of triplicate cultures. The data demonstrates that PKH26 labeling at 2 ÁM does not substantially affect proliferation as measured by 3H-thymidine incorporation. | ||||
Day 4, A540 Ratios | ||||
|---|---|---|---|---|
| PKH26 conc. | PHA Ág/ml | |||
| 0 | 0.5 | 2.5 | 10 | |
| 4 ÁM | 1.44 | 1.12 | 0.97 | 0.79 |
| 2 ÁM | 0.95 | 1.02 | 1.04 | 0.86 |
| 1 ÁM | 0.95 | 0.80 | 0.88 | 0.75 |
| 0.5 ÁM | 1.01 | 0.79 | 0.83 | 0.78 |
| 0.25 ÁM | 1.12 | 0.94 | 0.96 | 0.94 |
| 0 ÁM | 1.0 | 1.0 | 1.0 | 1.0 |
|
Table 3. The same untreated and PKH26-labeled cells from Table 3 were used to set up a parallel culture for the measurement of cell proliferation using MTT dye. On day 4, the cultures were incubated with MTT dye for 4 hours at 37░C and the insoluble chromogenic product was solubilized overnight. The extent of dye conversion, measured as absorbance at 540 nm (A540), is proportional to cell number. The results are given as ratios of A540 in PKH26 treated and untreated cultures. The results show PKH26 labeling up to 2 mM has no substantial effect on cell proliferation as measured by MTT dye method. | ||||
Cell Census Plus can utilize immuno-gating techniques to measure proliferation of a select subset of cells within the proliferating cell culture. As long as an antibody reagent is available that defines a cell subset, the proliferative activities of that subset can be measured.
The Cell Census Plus process is simple. First, label the entire cell population before exposing it to the proliferation stimulus. Labeled cells will have a characteristic fluorescence intensity at time zero. Cell Census Plus assumes fluorescent intensity will reduce by one half at each cell division and each daughter cell will retain half the dye present in the mother cell. Therefore, the intensity will be 1/2 in the first daughter generation, 1/4 in the second daughter generation, 1/8 in the third daughter generation, etc. In figure 3, a relatively homogeneous population of labeled cells simultaneously decreases in PKH26 fluorescence while increasing in cell number. Because heterogeneous cell populations do not divide synchronously, the histograms will broaden dramatically as the fluorescence decreases. At subsequent time points, the raw histogram represents the summation of all of the daughter generations.
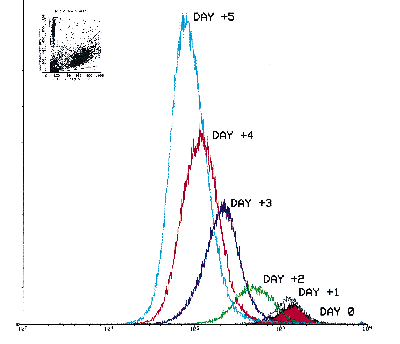
Figure 3.
The mouse lymphoid cell line, YAC-1, was labeled with PKH26 and allowed to divide under standard maintenance culture conditions. Flow cytometry data was obtained from aliquots of the culture on subsequent days with PKH26 reference microbeads added to the samples (see inset). Figure 3 is the overlay histogram of count-normalized PKH26 fluorescence data from Day 0 to Day 5. The data illustrate the simultaneous decrease in PKH26 fluorescence and increase in cell number as the cells undergo division in culture. (Data contributed by K. Muihead, Ph.D., Zynaxis and A. Schwartz, Ph.D., Flow Cytometry Standards Corp.) |
Next, ModFit Modeling Software (Verity Software) is used to analyze the data. ModFit is a computer program that deconvolutes the raw histogram data into peaks. Each peak represents a generation. The Cell Proliferation Model software provides the parameters for ModFit to perform the histogram deconvolution. It then calculates the proliferation index, a ratio of the total number of cells analyzed versus the calculated number of parental cells required for the observed cell number.
Lastly, the cells may be labeled with specific antibodies at the end of the culture period so that the proliferating activities of specific subpopulations may be studied. Figure 4 illustrates the value of immuno-gating in combination with the proliferative assays by flow cytometry. These figures show the proliferative activities to the mitogen PHA of the four lymphocyte subsets defined by CD4 and CD45RO antibodies. Clearly, proliferation activities of these four subsets are not equal under identical experimental conditions.
The deconvoluted histogram contains the history of proliferative activities. Unlike traditional methods of measuring cell proliferation, Cell Census Plus can detect the arrest of cell division in specific subpopulations through histogram deconvolution analysis.
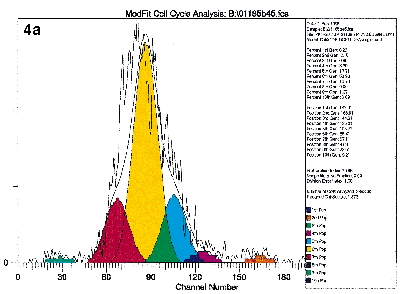
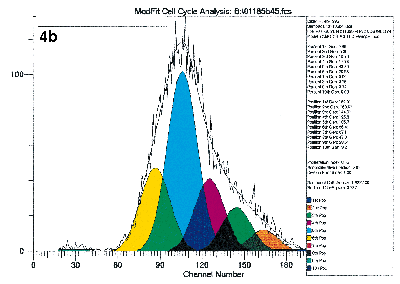
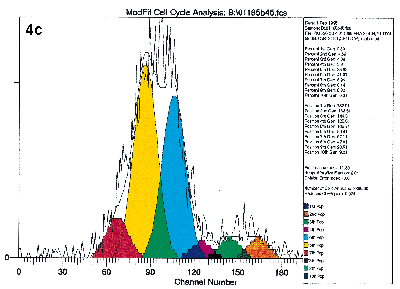
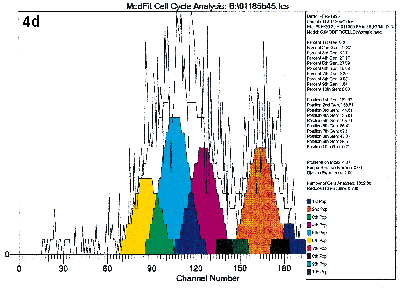
Figure 4a, 4b, 4c, 4d.
Human peripheral blood mononuclear cells were labeled with PKH26 dye, and stained with immunophenotyping reagents as described in Figure 1. The list mode data file for Figure 1b was reanalyzed after gating on the four subsets defined by FITC-CD4 and Quantum Red-CD45RO. Figure 4a and 4d show the results after deconvoluting the histogram. The shape of the raw PKH26 histogram for the four subsets are obviously different. Using Cell Census Plus, the different proliferative activities are seen as differences in relative abundance of the ten generations and Proliferative Index values.
The shape of the raw PKH26 histogram for the four subsets are obviously different. Using Cell Census Plus, the different proliferative activities are seen as differences in relative abundance of the ten generations and Proliferative Index values.
|
| Main Menu
| Online
Catalog | Technical Library
| Fields
of Interest |
| What's
New | On-line Ordering
| Sigma
Service | Site Index
|
![]()