Page 8
© 1988-2002 J.Paul Robinson,
Purdue University Cytometry Laboratories
BMS 602 LECTURE 9.PPT

Log amps
& dynamic range
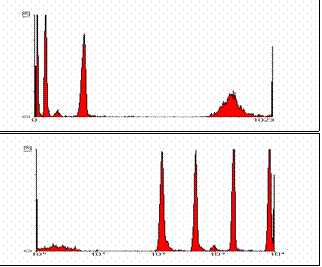
Compare the data plotted on a linear
scale (above) and a 4 decade log scale (below). The date are identical, except for the scale of the x axis. Note
the data compacted at the lower
end of the the linear scale are expanded in the log scale.