A novel approach to assess the respiration rate of microorganisms: case of the Chlorophycae Dunaliella tertiolecta (Butcher)
Gérald Grégori1*, Michel Denis1, Dominique Lefèvre1 & Beatriz Beker2
1 Laboratoire de Microbiologie, Géochimie et d'Ecologie Marines,
Université de la Méditerranée, CNRS UMR 6117, 163
avenue de Luminy, Case 901, 13288 Marseille cedex 9, France;
2 Centre d'Océanologie de Marseille, CNRS UMS 2196, Station Marine
d'Endoume, rue de la Batterie des Lions, 13007 Marseille, France
*Present address : Purdue University Cytometry Laboratories, Hansen Life
Sciences Research Building, B050, 201 S. University Street, West Lafayette,
IN 47907-2064,USA
Corresponding author: gregori@flowcyt.cyto.purdue.edu
Introduction
The production of organic matter in the ocean is essentially the result
of photosynthesis, a processus that has been intensively investigated
for many years. The main fraction of this organic matter is transformed
through the microbial trophic network and contributes to the energy transfer
to higher trophic levels. The biological oxidation of organic matter proceeds
through a variety of mechanisms that all converge towards the cell respiratory
system. Under aerobic conditions that represent the most common situation
throughout the water column, the last step of the electron transfer through
the respiratory system consists in molecular oxygen reduction, perceived
as oxygen uptake, coupled to metabolic production of carbon dioxide (CO2)
and synthesis of adenosine triphosphate (ATP), the cell energy fuel. The
mineralisation of organic matter is mostly due to microorganisms, and
in the aphotic layer, to heterotrophic bacteria. The resulting annual
metabolic CO2 production over the whole ocean was estimated
to be around 22 Pg C y-1 (Packard et al., 1988). Despite this
large value of oceanic budget, the instant rate of metabolic CO2
production is difficult to quantify by direct measurements and is usually
estimated by determining the cellular respiration rate. This is achieved
by indirect methods due to the low level of respiratory activity in oceanic
waters, keeping the oxygen uptake out of reach of currently available
direct techniques. Thus, bulk changes in dissolved oxygen concentrations
(Winkler method; Aminot, 1983) or in dissolved inorganic carbon (coulometry;
[13]) are assessed after long-term incubations (usually 24 hours) for
sea-surface samples. The lower activity level in the aphotic layer prevents
the extension of this approach below the euphotic layer. The enzymatic
assessment of cellular respiratory activity as developed by Packard (1971)
enabled addressing mineralisation down to the deep ocean. However, the
need to convert the potential respiratory activity determined by this
very sensitive method into in situ oxygen uptake rate by means of laboratory
established conversion coefficients fueled lasting controversies.
In the present paper, we propose to combine flow cytometry and the use
of fluorescent probes sensitive to membrane potential to face this lack
of direct measurement methods for determining in situ microbial respiratory
activity. The development of this new approach was based on (i) the existence
of a linear relationship between the oxygen flux and the proton electrochemical
potential difference (delta µH+) with respect to both sides of the
inner mitochondrial membrane in yeast mitochondria (Rigoulet et al., 1987)
and (ii) the availability of fluorescent probes sensitive to delta µH+.
The thus determined oxygen uptake rates can be expressed in terms of metabolic
CO2 production by using conversion coefficients (Redfield et
al., 1963; Takahashi et al., 1985).
Materials and methods
Phytoplankton culture
The unicellular organism chosen for the present work was the Chlorophyceae
Dunaliella tertiolecta (Butcher), strain CS-175 from the CSIRO Marine
Research Culture Collection (Hobart, Australia). It was grown under axenic
conditions on f/2 medium [10] at 20 °C, a salinity of 33 and with
an irradiance of 100 µE m-2 s-1 provided by fluorescent OSRAM lamps
with a 12 h light-dark cycle.
Cells were always collected in the exponential growth phase and kept in
the dark in order to address dark respiration and to prevent O2 production
would photosynthesis be activated.
Fluorescent probe
To monitor the cellular respiration by flow cytometry we used the fluorescent
dye carbocyanine dihexyloxacarbocyanine iodide (DiOC6(3), Molecular Probes,
USA), in 100 µM working solutions prepared in DMSO (Sigma Chemical
Co., USA).
Uncoupler
The respiration rate of D. tertiolecta was gradually enhanced by stepwise
addition of carbonyl cyanide m-chloro phenyl hydrazone (CCCP, Sigma, USA),
a potent uncoupler of mitochondrial electron transfer and proton translocation.
The CCCP working solution (3 mM) was prepared in ethanol. We allowed for
10 min incubation time to compensate for small uncoupling efficiency variations
between different CCCP batches.
High-resolution respirometry
D. tertiolecta respiration rates were recorded with the high-resolution
oxygraph OROBOROS (Paar, Innsbruck, Austria), equipped with two measurement
chambers (Gnaiger et al., 1983; 1995; 1998). The temperature in the chambers
was set at 20 °C and controlled by a device based on the Pelletier
effect. Cell suspensions were homogenized with a magnetic stirrer (600
rpm), and left to equilibrate with the atmosphere in the open chamber
before signal calibration. Oxygen concentration was computed from the
partial pressure measured by the electrode. During oxygen uptake measurements,
each chamber (3 cm3 working volume) was closed by a piston
to prevent oxygen exchange with the atmosphere. Data were recorded on
a desktop computer every 0.4 s by using the Datlab Acquisition software
(Paar, Innsbruck, Austria). Data analysis was run with the Datlab Analysis
software (Paar, Innsbruck, Austria) to calculate oxygen consumption rates
(µM.h-1), and correct them from the electrode shift.
The O2-concentration-measurement uncertainty with the OROBOROS
oxygraph was 0.036 µM O2 against 0.500 to 1.000 µM
O2 for other commercial instruments.
Flow cytometry
Single cell analyses were run with a CYTORON ABSOLUTE (ORTHO Diagnostic
Systems) flow cytometer, equipped with an air-cooled argon laser (excitation
wavelength at 488 nm). Each cell was characterized by 5 optical parameters:
two scatter parameters, namely forward angle scatter (related to the particle
size) and right angle scatter (related to cell structure and shape), and
three fluorescence parameters related to emissions in the red (> 620
nm), orange (565-592 nm) and green (515-530 nm) wavelength ranges. Data
were collected and stored in list-mode on a personal computer with the
IMMUNOCOUNT software (ORTHO Diagnostic Systems). Due to the control of
the sample volume by a microsyringe, this software can directly provide
cell concentrations (cells mm-3). The Winlist software (Verity Software,
USA) was used to determine statistical data.
Results
Titration of D. tertiolecta respiration
To cover a meaningful range of oxygen uptake rates, the respiration rate
of D. tertiolecta was enhanced by stepwise addition of increasing amounts
of CCCP, an uncoupler whose effect results in stimulating electron transfer
and consequently, dioxygen uptake (Heytler, 1981, Rottenberg & Wu,
1998). The observed maximum enhancement (3.8 fold) corresponded to fully
uncoupled mitochondria. Increasing values of O2 uptake rate by D. tertiolecta
were determined with the oxygraph after addition of increasing amounts
of CCCP. As illustrated by Figure 1, we found a linear relationship between
CCCP concentration and O2 uptake rate by D. tertiolecta.
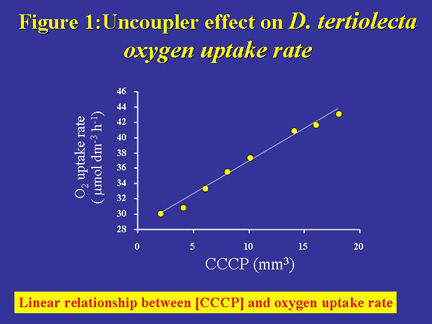
Figure 1. Relationship between the rate of oxygen uptake by D. tertiolecta and CCCP concentration. The straight line reveals the existence of a linear relationship between oxygen uptake rate and CCCP concentration: y = 2.45x + 17.18; R2 = 0.99; n = 9.
Staining of D. tertiolecta
Control experiments run with DiOC6(3) concentrations < 100 µM
ensured that the dye had no apparent toxic effect during the time course
of the observations. Indeed, oxygen uptake rates of stained cells (47.1
± 5.8 µmol O2 dm-3 h-1) were found not significantly different
(10 measurements; p < 0.05) from that (46.1 ± 2.1 µmol
O2 dm-3 h-1) in absence of dye.
We defined an optimal dye concentration at 30 nM DiOC6(3) and optimum
staining was ensured by incubating D. tertiolecta cells 30 min in presence
of DiOC6(3) before flow cytometric analysis. Staining of D. tertiolecta
was controlled by epifluorescence microscopy (not shown).
Monitoring of respiration
To titrate the fluorescence of DiOC6(3) stained D. tertiolecta
cells, subsamples were pretreated with increasing amounts of CCCP and
incubated 30 min with DiOC6(3) at 30 nM final concentration
before flow cytometric analysis. Addition of CCCP decreased delta µH+
which resulted in the decrease of the green fluorescence signal of the
stained cells as illustrated in Figure 2. We thus obtained a linear relationship
between CCCP concentration and the cell mean green-fluorescence intensity
(Figure 2). When mitochondria were fully uncoupled, the cell mean-green
fluorescence intensity was similar to that of cells without staining (about
4 a.u., Figure 2).
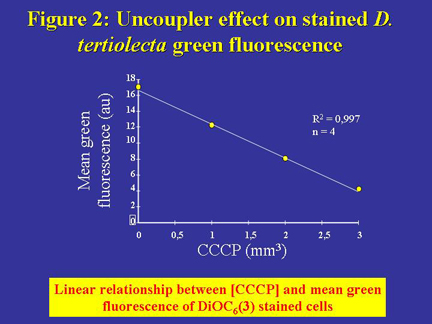
Figure 2. Relationship between D. tertiolecta cell mean green fluorescence intensity and CCCP concentration. Note that the dye was supplemented after CCCP addition. The straight line expresses a linear relationship between the cell mean green fluorescence intensity (in arbitrary units, au) and CCCP concentration: y = -12.82x + 16.82; R2 = 0.997; n = 4.
Conversion scale
From the two linear relationships obtained independently between CCCP
concentration and D. tertiolecta oxygen uptake rate on the one hand and
green fluorescence of stained D. tertiolecta on the other hand, we can
conclude to the existence of a linear relationship between D. tertiolecta
oxygen uptake rate and its green fluorescence when stained with DiOC6(3).
The ensuing conversion scale can be easily constructed from two specific
values (derived from the fully coupled and fully uncoupled states respectively)
of D. tertiolecta oxygen uptake rate and the associated green fluorescence
of cells in the exponential growth phase, stained with DiOC6(3). Both
oxygen uptake rates (17 and 64 fmol O2 cell-1 h-1 for cells in fully coupled
and fully uncoupled states respectively) can be considered as specific
features of D. tertiolecta in exponential growth phase. As long as fluorescence
values are expressed in arbitrary units, the conversion scale will only
be valid for the instrument with which it was established. The linear
conversion scale for our flow cytometer is presented in Figure 3. The
green fluorescence values were corrected from the residual signal recorded
with unstained cells.
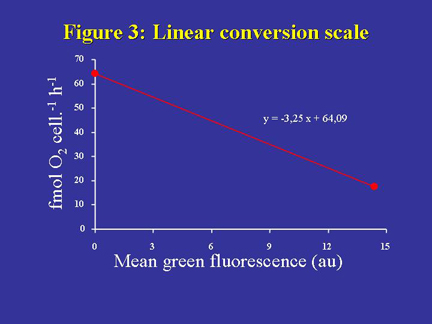
Figure 3. Linear conversion scale between the cell O2 respiration rate and the cell mean green fluorescence intensity (in arbitrary units, au) for D. tertiolecta stained with 30 nM DiOC6(3). The linear scale is based on two specific respiration rates of D. tertiolecta in exponential growth phase, corresponding to fully coupled and fully uncoupled states respectively, and the associated fluorescence intensities. The resulting linear equation, y = -3.25x + 64.09, is therefore only valid for the instrument in use. To make this relationship instrument-independent would require a standardization of fluorescence measurements.
Validation
To check the efficiency of the linear conversion scale, we conducted an
experiment in which the oxygen uptake rate of D. tertiolecta was measured
directly with subsamples supplemented with CCCP (10 min) then with DiOC6(3)
(30 min). Once the oxygen uptake rate was measured, the cell suspension
was removed from the oxygraph chamber to be analyzed by flow cytometry.
The cell mean green fluorescence for each respiratory stage was corrected
from the residual signal recorded with unstained cells and then converted
to oxygen uptake rate by using the conversion scale shown in Figure 3.
Figure 4 shows that calculated and measured oxygen uptake rates are not
significantly different within the experimental uncertainties (R2 = 0.984;
21 measures).
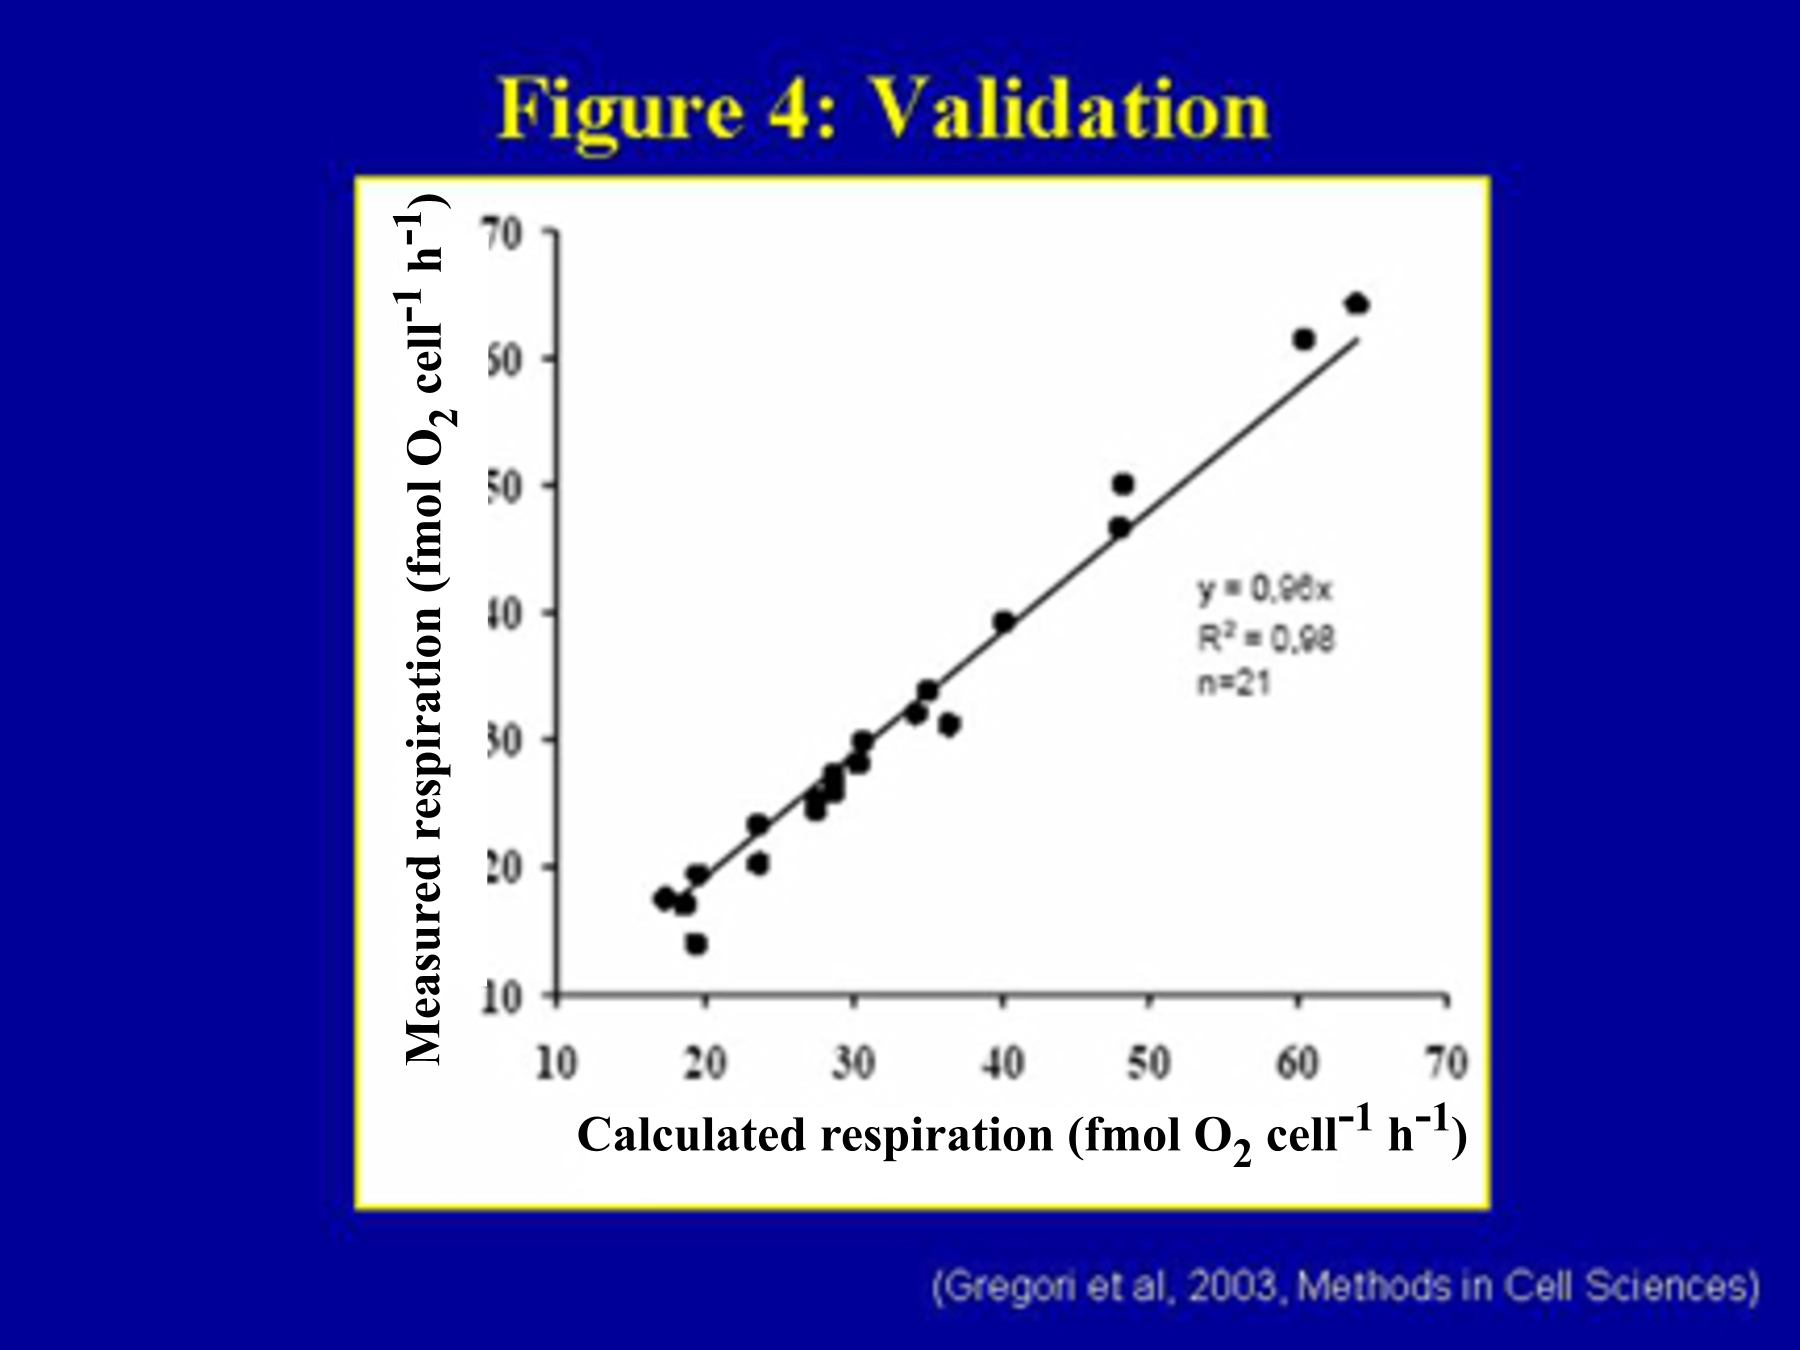
Figure 4. Comparison between measured and calculated mean cell respirations. The reported D. tertiolecta cell mean respiration rates were measured directly with the oxygraph and derived from the green fluorescence recorded by flow cytometry by using the linear scale conversion plotted in Figure 6. The straight line demonstrates a tight correlation between both data sets (y = 0.96x, R2 = 0.98, n = 21).
Discussion
The established linear relationship between oxygen uptake rate and membrane
potential (through CCCP tuning, Figure 1) extends to the whole cell a
finding reported for isolated purified yeast mitochondria (Rigoulet et
al., 1987). It enables a simple and direct conversion of fluorescence
signals into oxygen uptake rates (Figure 3).
By demonstrating the feasibility to derive the respiration rate of D.
tertiolecta from flow cytometric measurements, we opened the way to the
extension of this approach to the other microorganisms. Indeed, this approach
is based on the chemiosmotic theory of Mitchell (1961) which accounts
for the bioenergetics of all cells, whether eukaryotes or prokaryotes.
However, if there is no theoretical argument to preclude the extension
of the present approach, experimental difficulties may be encountered
in the way ahead. Whatever these difficulties, the present study opens
the way to a new, elegant and efficient way to quantify cell respiration
and subsequently, mineralisation by microorganisms, a major challenge
in oceanography.
Acknowledgements
The authors wish to thank S. Brown and D. Marie for their encouragements
and precious advices at the early stage of this work. G. G. was the recepient
of a doctoral fellowship from the Council of the Provence-Alpes-Côte-d'Azur
Region. Figures were reproduced from Gregori et al. (2002) with kind permission
of Kluwer academic Publishers.
Cited references
Aminot A (1983) Dosage de l'oxygène dissous. In: CNEXO, (ed). Manuel
des analyses chimiques en milieu marin, pp 75-92. Brest.
Gnaiger E, Forstner H (1983) Polarographic sensors, Aquatic and physiological
applications. Gnaiger E, Forstner H (eds). Berlin/Heidelberg/New York:
Springer-verlag.
Gnaiger E, Steinlechner-Maran R, Méndez G, Eberl T, Margreiter
R (1995) Control of mitochondrial and cellular respiration by oxygen.
J Bioenerg Biomemb 27(6): 583-596.
Gnaiger E, Kuznetsov AV, Lasnig B, Fuchs A, Reck M, Renner K, et al. (1998)
High-resolution respirometry - optimum permeabilization of the cell membrane
by digitonin. In: Larsson C, Pahlman TL, Gistatsson L, (eds), Bio thermokinetics
in the post genomic era, pp 89-95. Göteborg: Chalmers Reproservice.
Grégori G, Denis M, Lefèvre D, Beker B (2002) A flow cytometric
approach to assess phytoplankton respiration. Methods in Cell Science
24: 99-106.
Guillard RRL, Ryther JH (1962) Studies of marine planktonic diatoms. Part
1: Cyclotella nana Hustedt and Detonula confervacea (Cleve) Gran. Can
J Microbiol 8: 229-239.
Heytler PG (1981) Uncouplers of oxidative phosphorylation. In: Erecinska
M, Wilson DF (eds), Inhibitors of mitochondrial function: Pergamon Press
pp. 199-210.
Johnson KM, Sieburth JM (1987) Coulometric total carbon dioxide analysis
for marine studies: automation and calibration. Mar. Chem. 21: 117-133.
Mitchell P. (1961) Nature (Lond.) 191: 144-148.
Packard T (1971) The measurement of respiratory electron transport activity
in marine phytoplankton. J Mar Res 29: 235-244.
Packard T, Denis M, Rodier M, Gardfield P (1988) Deep ocean metabolic
CO2 production calculations from ETS activity. Deep-Sea Res. 35(3): 371-382.
Redfield AC, Ketchum BH, Richards FA (1963) The influence of organisms
on the composition of sea-water. In: Hill MN (ed), The Sea, pp 26-77.
New York: Wiley-Interscience.
Rigoulet M, Guérin B, Denis M (1987) Modification of flow-force
relationships by external ATP in yeast mitochondria. Eur J Biochem 168:
275-279.
Rottenberg H, Wu SS (1998) Quantitative assay by flow cytometry of the
mitochondrial membrane potential in intact cells. Biochim Biophys Acta
1404: 393-404.
Takahashi T, Broecker WS, Langer S (1985) Redfield ratio based on chemical
data from isopycnal surfaces. J Geophys Res 90: 6907-6924.