Intracellular
Staining Techniques: Analysis of In Vivo Cytokine Production
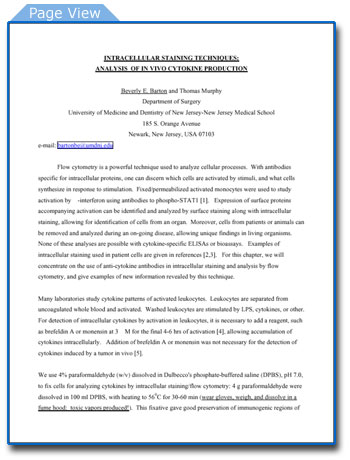
Click Image To View PDF |
|
View this document as a Microsoft Word file
Flow cytometry is a powerful technique used to analyze cellular processes.
With antibodies specific for intracellular proteins, one can discern which
cells are activated by stimuli, and what cells synthesize in response
to stimulation. Fixed/permeabilized activated monocytes were used to study
activation by ?-interferon using antibodies to phospho-STAT1 [1]. Expression
of surface proteins accompanying activation can be identified and analyzed
by surface staining along with intracellular staining, allowing for identification
of cells from an organ. Moreover, cells from patients or animals can be
removed and analyzed during an on-going disease, allowing unique findings
in living organisms. None of these analyses are possible with cytokine-specific
ELISAs or bioassays. Examples of intracellular staining used in patient
cells are given in references [2,3]. For this chapter, we will concentrate
on the use of anti-cytokine antibodies in intracellular staining and analysis
by flow cytometry, and give examples of new information revealed by this
technique.
Many laboratories study cytokine patterns of activated leukocytes. Leukocytes
are separated from uncoagulated whole blood and activated. Washed leukocytes
are stimulated by LPS, cytokines, or other. For detection of intracellular
cytokines by activation in leukocytes, it is necessary to add a reagent,
such as brefeldin A or monensin at 3 ?M for the final 4-6 hrs of activation
[4], allowing accumulation of cytokines intracellularly. Addition of brefeldin
A or monensin was not necessary for the detection of cytokines induced
by a tumor in vivo [5].
We use 4% paraformaldehyde (w/v) dissolved in Dulbecco's phosphate-buffered
saline (DPBS), pH 7.0, to fix cells for analyzing cytokines by intracellular
staining/flow cytometry: 4 g paraformaldehyde were dissolved in 100 ml
DPBS, with heating to 560C for 30-60 min (wear gloves, weigh, and dissolve
in a fume hood: toxic vapors produced!). This fixative gave good preservation
of immunogenic regions of cytokines. Harvested cells were washed twice
by centrifuging at 250g x 10 min, and resuspending in cold DPBS/1% heat-inactivated
bovine calf serum/0.01% NaN3 (FACS buffer). One million washed cells per
aliquot were fixed in 0.25 ml for 25-30 minutes on ice. Cells were washed
in 2 ml cold FACS buffer/tube, centrifuging as above. Washing was done
twice. After the second wash step, cells were resuspended in 0.25 ml/sample
0.1% saponin (w/v) in DPBS (Perm/Wash buffer) for 20 minutes on ice. Some
laboratories report using up to 0.5% saponin, with good results [6]. Once
the cells were exposed to the permeabilization agent, it was necessary
to maintain the cells in Perm/Wash buffer during washing and staining
steps, for effective staining. Cells were pelleted by centrifugation at
500g x 5 min at 40C.
Other methods for fixing and permeabilizing cells use methanol or formalin in buffer as the fixative [1], while Caltag sells a proprietary reagent which permanently permeabilizes cells once they have been treated. In our hands, the paraformaldehyde/DPBS was the best method for fixing, while the saponin buffer was the best method for permeabilization. For some intracellular antigens, such as phosphorylated signalling intermediates, the addition of methanol to the fixing procedure was found to enhance detection of signal over noise [1].
Thorough washing of cells is essential for low backgrounds; we always
did 3 washes, with the first wash including incubation in buffer for the
same length of time the cells were exposed to antibody or fluorochrome.
Furthermore, biotinylated antibodies for the primary staining gave lower
backgrounds than either unconjugated antibodies or F(ab)2' fragments.
Fixed/permeabilized cells were washed, then resuspended in 0.1 ml 10 mg/ml
mouse Ig and kept for 45 min on ice, to block Fc receptors and reduce
background staining due to non-specific protein:protein interactions.
After the 45 minute period, cells were resuspended in 1 ml/sample Perm/Wash
buffer for 45 min before centrifugation (500g x 5 min). Pelleted cells
were washed twice, without the 45 min incubation prior to centrifugation.
Cells were resuspended in 0.1 ml Perm/Wash buffer/0.1% bovine calf serum,
and stained with biotinylated antibodies to cytokines of interest; we
have looked at IL-6, IL-11, oncostatin M (OSM), and leukemia inhibitory
factor using this protocol, with equal success.
Generally, 0.1 ?g of antibody in 100 ?l Perm/Wash buffer/0.1% bovine
calf serum was sufficient to stain the cells, but each laboratory should
determine the optimal concentration for the antibodies used. Cells were
incubated with primary antibody for 45 min on ice. For the first wash
step, cells were incubated for 45 min in 1 ml of Perm/Wash buffer/0.1%
bovine calf serum before centrifugation (500g x 5 min); subsequent washes
were done without the long incubation time. After the final wash, cells
were resuspended in 0.1ml Perm/Wash buffer/0.1% bovine calf serum.
Streptavidin-phycoerythrin(PE) was used for the fluorochrome, because
of its high quantum yield so that the sensitivity of detection would be
high. Ten ?l of streptavidin-PE (Pharmingen; 0.5 mg/ml) were added to
each sample in 100 ?l Perm/Wash buffer/0.1% bovine calf serum; a sample
stained only with streptavidin-PE was always included. Covering samples
with foil prevents photobleaching. After 45 min incubation, cells were
washed in Perm/Wash buffer/0.1% bovine calf serum, commencing with a 45
min incubation in Perm/Wash buffer/0.1% bovine calf serum prior to centrifugation.
Two subsequent washes were done also. Washed samples were resuspended
in 1 ml cold FACS buffer and analyzed on our Becton-Dickinson FACScan
with an argon laser. CellQuest software was used to acquire 10,000 ungated
events and to analyze data. Alternatively, after the final wash and resuspension,
tubes can be covered with Parafilm and foil, and stored overnight in the
refrigerator. For longer storage, resuspend the cells after the final
wash in 0.1 ml FACS buffer. Prior to acquiring, bring the volume of each
tube to 1 ml with cold FACS buffer.
This is a long procedure from start to finish; some may find that it cannot
be completed within 1 workday. Cells can be stored overnight or longer
in the fixative in the freezer. Cells can be stored in
Perm/Wash buffer. Remember: if you store cells containing Ab or fluorochrome
for a long period, you will have to incubate them in washing solution
for the same length of time, so don't put cells in Ab, fluorochrome, or
blocking Ig in the refrigerator for the weekend!
Set PMT voltage and compensation, if necessary, on the fluorochrome control
(in our case, the streptavidin-PE-only stained cells). Set the FSC and
SSC values based on unstained (blocked) sample(s). Block every sample,
to avoid the need to compare blocked sample vs. unblocked sample. If cells
are surface-stained (done before fixing/permeabilizing) as well as intracellularly-stained,
set the PMT voltage and compensation using surface-stained controls.

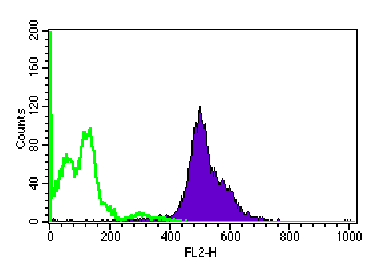
Figure 1: Constitutive expression of OSM by bone marrow cells of B6 mice is revealed by intracellular staining of fixed/permeabilized cells, followed by analysis on a FACScan.
Our laboratory studied the pathophysiology of the IL-6 cytokine family for some time; we used intracellular staining to study the pattern of induction of IL-6-like cytokine expression in hematopoietic organs of mice following tumor transplant. The induction was studied in SCID mice following intravenous administration of human myeloma, and also in C57BL/6 (B6) mice following subcutaneous injection of LL/2 squamous cell carcinoma. At times after administration of tumor, mice were euthanized; bone marrow and spleens were made into single cell suspension, and fixed/permabilized/stained as described to analyze the IL-6-type cytokine expression pattern. Biotinylated antibodies were purchased from R&D Systems, while streptavidin conjugates, fixative, and permeabilization reagents were from Pharmingen. In all figures, histograms show mean channel of fluorescence of antibody-stained sample in purple compared to streptavidin-PE-only-stained sample in green. Figure 1 shows that bone marrow of naïve C57BL/6 mice expressed high levels of OSM.

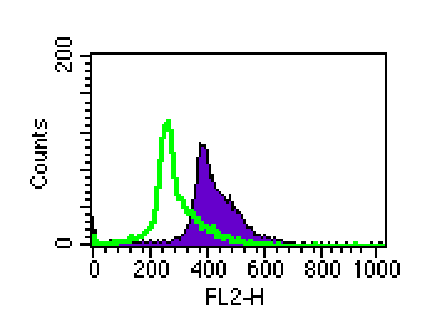
Figure 2: IL-6 expression in spleen cells of SCID mice was induced by human myeloma cells, as revealed by intracellular staining for IL-6 on fixed/permeabilized cells. Analysis was performed on a FACScan, using CellQuest software for acquisition and analysis
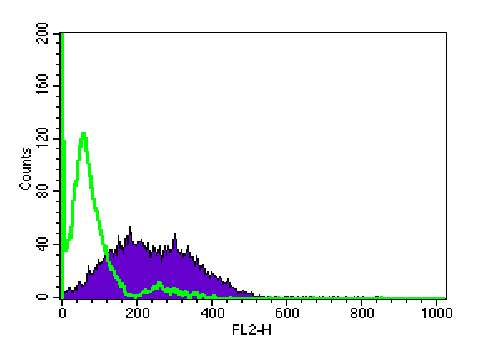
Figures 2 and 3 shows that when tumor growth was detected, either by measuring
diameters of the solid LL/2 tumor, or by ELISA for myeloma-derived serum
protein, IL-6 and/or OSM were induced in spleens of both strains of mice,
even though tumor cells were not present in this organ. Spleens of naïve
mice expressed no cytokine (data not shown).
Presence of tumors induced synthesis of IL-6 and OSM in tumor-free spleens of host mice; bone marrow cells constitutively expressed these cytokines, which are myeloma growth factors. It is possible that myeloma cells accumulate in bone marrow because growth factors present there induce proliferation [5].
These studies depended on intracellular staining to allow the analysis of proteins synthesized in tumor-bearing mice. This technique was used successfully in patients to study the types of T cells activated by rheuamtoid arthritis, allergic asthma, and atopic dermatits [7].
For a complete discussion on the detection of intracellular proteins by many methods, the reader is referred to the work of Bauer and Jacobberger [8]. There is much more information in this article than space allows here.

Figure 3: Subcutaneous administration of LL/2 tumor cells in the flanks of B6 mice induced IL-6 expression in the spleen by day 7. Fixed/permeabilized spleen cells were analyzed on a FACScan after staining with biotinylated anti-mouse IL-6, followed by incubation with streptavidin-phycoerythrin, and analysis on a FACScan.
REFERENCES
1) Fleisher, T.A., Dorman, S.E., Anderson, J.A., Vail, M., Brown, M.R.,
and Holland S.M. Clinical Immunology 90: 425-430 (1999).
2) Jennings, C.D. and Foon, K.A. Blood 90: 2863-2892 (1997).
3) Groeneveld, K., te Marvelde, J.G., van den Beemd, M.W.M., Hooijkas,
H., and van Dongen, J.J.J.M. Leukemia 10: 1383-1389 (1996).
4) Jung, T. Schauer, U., Heusser, C., Neumann, C., and Rieger, C. Journal
of Immunological Methods 159: 197-207 (1993).
5) Barton, B.E. and Murphy, T. Cytokine 12: In press (2000).
6) Crucian, B.E. and Widen, R.H. In Methods in Molecular Biology (ed.
M.J. Jaroszeski and R. Heller), Vol. 91, pp. 37-46. Human Press, Totowa,
N.J. (1997).
7) Schuerwegh, A.J., De Clerck, L.S., De Schutter, L., Bridts, C.H., Verbruggen,
A., and Stevens, W.J. Cytokine 11: 783-788 (1999).
8) Bauer, K.D. and Jacobberger, J.W. Methods in Cell Biology 41: 351-376.
(1994).


