Performing reticulocyte
analysis is easier and faster than ever!
When you are ready to get down to the
business of reticulocyte analysis, you're ready for ReticFit.
From the ground up, we have designed this program to be the
quickest, most automatic retic software you will ever use. We
started by talking to the experts in the field. Then we sat down
and watched the way they worked. That was enough to get us
started. We had only just begun, though. Our test crew in the
field tested and retested. With each test cycle, we worked the
suggestions of expert and novice users into the program to make
it work the way they, the users, wanted it to work. ReticFit is
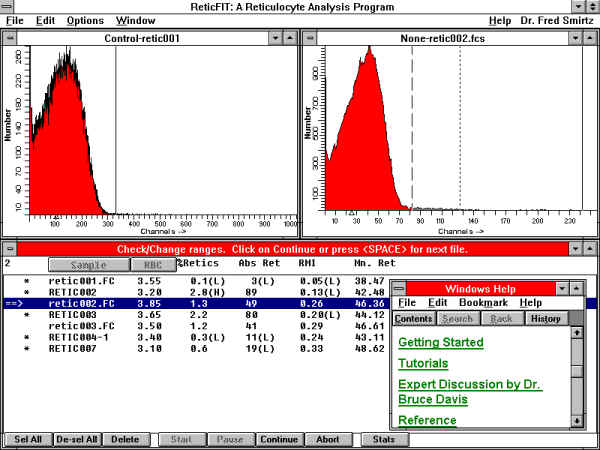
the result. With ReticFit, you simply select control and test
files with your mouse, click on the Start button, and away you
go! With built-in pause control, you can adjust your range
cursors as you go, but ReticFit positions them automatically,
too. Statistics for percent retics, absolute retics, mean retics,
and RMI are performed in the blink of an eye. And there is even
an expert discussion in our on-line help system.
ReticFit
Printing options for text-only, or mixed
text and graphics reports.
Control histogram is automatically scaled.
Range cursors are automatically placed by programmable area
percentage.
Edit sample id and red blood count quickly and efficiently.
Easy access push buttons make tasks quick and easy.
On-line help and tutorials with expert discussion.
Color-coded graphics indicate RMI area.
Results are flagged when outside user-defined ranges.
View all control-test pairs in the job easily.
Obtain statistics on all analyzed items.

1. Edit information related to the job.

2. Match up control and test files to create a batch.

3. Confirm ReticFit's automatic cursor placement.

4. Review, print, and save your analysis results.
Features
Point
and click to match controls with tests.
Create
test batches of virtually any size.
Edit
red blood count and sample id quickly and
efficiently.
Identify
each job by name, date and operator.
Start,
pause, abort, and continue analysis with single
mouse click.
Read
all analysis results as they are performed.
Identify
normal ranges for your data.
Flag
results outside of normal ranges, high and low.
Setup
automatic cursor positioning based on your data.
Enter
positioning information as percentages of the x
scale for consistency between files and labs.
Define
upper channel boundary for test files to
eliminate unwanted data.
Adjust
control and test cursors on the fly.
Set
range for automatic control cursor positioning,
with alerts for movement outside of range.
Calculate
percent retics, absolute retics, mean retics, and
RMI with lightning speed.
Select
which statistics are displayed on the screen.
Choose
the fonts and colors you want to display.
|
Print
multiple page graphical reports.
Print
statistical report for entire job.
Work
with your FCS listmode and histogram formats.
Gate
your FCS listmode files.
Save
results in delimited database for MIS
integration.
Keep
cumulative statistics for analyses over time.
Save
histograms as pictures.
Extract
FCS keywords for test file identification.
Install
and setup the program in minutes.
Work
entirely in the Microsoft WindowsTM environment.
Multi-task
with other applications.
Use
your MS-DOS PC for off-line analysis.
Refer
to the fully illustrated operations manual.
Find
help quickly with On-line help - just a click
away.
Print
to any of the hundreds of printers, slide makers,
and film recorders supported by Windows.
Copy
to the Windows Clipboard in popular bitmap,
metafile, and text formats.
Connect
with other Windows applications via DDE.
|
![[HRule Image]](images/div.gif)
Send mail to verity@vsh.com with questions or comments about this web site.
Copyright © 1996-97 Verity Software House,
Inc.
Last modified: October 27, 1997