

 email:
Robert_Zagursky@internetmail.pr.cyanamid.com
Nontypeable Haemophilus influenzae (NTHi) cells were stained in 1.5 ml microcentrifuge tubes. A 200 ul
volume of a cell suspension (OD600 approximately 0.04 when brought to 1.0 ml of PCM [PCM buffer: 10mM NaPO4, 150mM NaCl, 0.5 mM MgCl2, 0.15mM CaCl2])
was stained with primary antibody (1:200) for one hour at 37 C. Cells were washed and stained with secondary biotinylated antibody (1:20)
for 15 minutes at 37 C, and then washed and stained with Quantum Red-conjugated streptavidin (1:40, Sigma) for
15 minutes at 37 C. One ml of PCM was added to the labelled cells, washed and resuspended in a final volume of
1 ml PCM.
We have analyzed dead as well as viable cells using the viability stain Syto 9 (Molecular Probes)
added before analysis according to the manufacturer's specifications. In our particular applications, we
find no evidence of nonspecific staining of dead cells. This can be advantageous when analyzing biohazardous
organisms, in that a bulk suspension of dead cells can be prepared and analyzed at one's leisure, as opposed to
staining a viable cell suspension, fixing, and assessing survival before analysis.
We collected events triggered on side scatter (SSC) with a threshold of 0. As discussed below,
the SSC PMT is more sensitive than the forward scatter (FSC) photodiode, and so we used this parameter to
trigger. Typically we do not set a higher threshold or gate on either light scatter parameter; when it is
necessary to discriminate cells from debris we use an additional parameter, as described below. For all analyses,
FSC and SSC were set in log mode; the FSC gain was EO1 and the SSC gain and voltage were typically 1 and 300.
FL1, FL2, and FL3 were also in log mode with gains of 1-2 and voltages set to 400-600, as warranted by comparisons
of control-stained and specifically-stained cells. Superior results were obtained when the suspension was sampled
on a low setting (12 Šl/min), giving a data acquisition rate of no more than 300-600 events/second. With higher
flow rates we observed increased light scatter and fluorescence, but with a greater CV. We concluded that under
these conditions there is a greater chance for coincidence, where multiple cells may be analyzed as a single event.

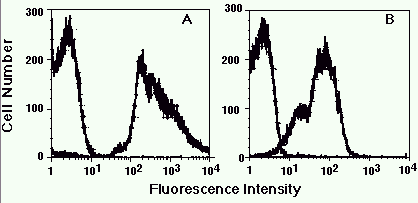
Figure 1. Detection of serotype-specific determinants on different N. meningitidis strains.
Heat-killed suspensions of strain 1 (A) and strain 2 (B) were stained with monoclonal antibodies
specific to one strain or the other, and then analyzed. The fluorescent histograms for both
stains are shown in each panel. For both strain 1 and strain 2, the monoclonal with the
inappropriate reactivity stained at background levels whereas the reactive monoclonal gave a
shift in fluorescence.

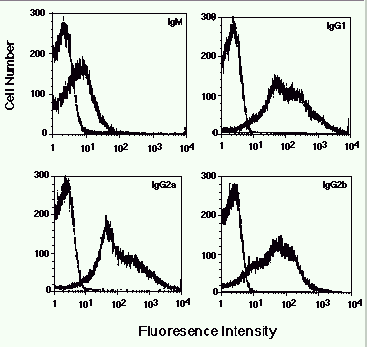
Figure 2. Detection of antigen-specific isotypes in sera from vaccinated mice. In each
panel is shown the fluorescence of strain 1 cells stained with a 1/100 dilution of pre- or
post-vaccine serum followed by the indicated secondary antibody.
The asymmetry of the right-shifted one-parameter histograms in Figures 1 and 2 is notable. In fact,
with specifically-stained cells we observed increases not only in the fluorescent signal, but light scatter as well.
We have concluded that these changes are derived from antigen-antibody complexes, for several reasons. First,
aggregates were evident by fluorescent microscopy; second, the more brightly fluorescent cells had higher FSC and
SSC as well, with all three parameters showing a direct relationship; third, these characteristics were seen with
specific stain but not control stain; and fourth, a mild bath sonication step reduced FSC and SSC signals to the
level of control-stained cells, and caused a reduction in the fluorescent CV, being more symmetrical, but
maintaining similar peak fluorescence. Some of these results are shown in Figures 3 and 4.
Figure 3. Light scatter of stained and unstained strain 1 cells. A). FSC and SSC are shown
for cells that were stained with antibody. B). The same sample as in A was bath sonicated for 5
seconds, and then immediately analyzed. C). FSC and SSC of unstained cells.
Figure 4. Effect of sonication on the fluorescence profile of stained cells. A). Strain 1
was stained, washed and analyzed. B). The same sample as in A was sonicated and then immediately
analyzed.
In Figure 3A it can be seen that light scatter increased in specifically stained cells compared to the unstained cells in Figure 3C;
when the same tube was bath sonicated for 5 seconds, light scatter was equivalent to that of unstained cells
(Figure 3B). Figure 4 shows the effects of sonication on the fluorescent signal of specifically-labeled cells.
Figure 4A shows the fluorescence of cells stained with a reactive primary antibody, followed by a FITC-conjugated
secondary antibody. As also seen in Figures 1 and 2, the fluorescent histogram was asymmetric; the most brightly
fluorescent cells also had the greatest FSC and SSC (not shown). After sonication, light scatter was reduced, as
in Figure 3; fluorescence was reduced as shown, resulting in a more symmetric peak. From these data we conclude
that fluorescence and light scatter signals from a portion of the events in these samples is the collective signal
of cells trapped in an antigen-antibody complex. Thus some events in these samples consist of complexes of cells
recorded as a single event, with light scatter and fluorescence signals not the result of a single-cell event, but
rather the sum of the individual signals of all the cells trapped in the complex.
These results demonstrate the serological specificity of bacterial strains. Although there can be aggregation
in stained samples, this effect is dependent on a specific reaction between an antibody and its antigen. Thus in
situations where a qualitative question is being asked, as in strain serotyping or identification of bacterial
species in environmental or biological samples, aggregation in itself would not invalidate the result. Obviously,
though, aggregation does present a problem in studies of expression levels of a determinant. For this reason we
wished to define the parameters critical in examining single-cell events on the FACSort.
Figure 5. Light scatter profiles of 0.2, 0.5 and 1.0 micron beads. A). FSC
histogram. B). SSC histogram.
As can be seen in Figure 5A, the 0.2 and 0.5 micron beads could not be distinguished with FSC. However, the
1.0 micron beads showed a shift in the FSC parameter. In contrast, each of the three bead sizes was clearly
resolved on the basis of SSC (Figure 5B). Thus in our hands, the FACSort has a limited capacity to resolve
particles less than 1 micron in size on the basis of FSC; but SSC is much more sensitive and can resolve
particles at least as small as 0.2 microns. These results are consistent with the differences in sensitivities
of the photodiode and photomultiplier tube used in the detection of FSC and SSC, respectively. There are two
consequences that follow from these observations. First, we prefer to trigger on SSC, since FSC is less sensitive
and may not trigger for some bona fide events. Second, we do not rely exclusively on FSC and SSC thresholds or
gates to resolve bacterial cell populations less than 1 micron in size, but use an additional parameter as
discussed below.
Figure 6. The effect of sample density on the fluorescence profile. Strain 1 was
stained, washed, sonicated and analyzed. Shown are the fluorescent profiles of A) undiluted
cells, B) cells diluted 1/4, and C) cells diluted 1/16.
In order to distinguish cells from debris, we fluorescently labelled the bacteria using the intracellular
viability stain, Syto 9, and detected viable bacteria using one of the fluorescent PMTs. Suspensions of viable
NTHi cells were stained with antibody plus secondary, washed, resuspended in 1.0 ml, and then counter-stained
with Syto 9.
Figure 7. Identification of antibody labelled and Syto 9 stained NTHi cells: analysis
gate. A). Light scatter profile of the cells. B). FL1 (Syto 9) fluorescent histogram of the
cells. C). FL3 (Quantum Red) fluorescent histogram of the cells. D). Resultant FL3 fluorescent
histogram when gated on Syto 9 positive cells.
Figure 7A shows the light scatter of these cells. In this particular run there was less debris
than is often seen, and a distinct population was suggested by light scatter. However, debris was evident and
in fact the apparent bacterial cell population, as defined by light scatter, represented only 15% of the total
events. Figure 7B shows the profile obtained with the viability stain, with the positive population also
representing about 15% of the total events. Figure 7C shows the staining profile obtained with a NTHi-specific
antibody: again, 15% of the total events were positive. Without the means to definitively resolve the bacterial
cells, we could not make any conclusions about the percentage of positive cells. In Figure 7D, a post data
analysis gate was used to analyze only Syto 9 positive events and it can be seen that essentially all of these
events stained with the NTHi-specific antibody. Dual-parameter analysis of Syto 9 staining versus antibody
staining indicated that all Syto 9 positive events were antibody positive, and all antibody positive events were
Syto 9 positive (not shown).
Figure 8. Identification of antibody labelled and Syto 9 stained NTHi cells: acquisition
gate. A). Light scatter of the gated cells. B). FL3 fluorescent histogram of gated cells. C).
FL3 fluorescence histogram of only Syto 9 labelled cells.
Analogous results (Figure 8) were obtained when a data acquisition gate was used to
collect only Syto 9 positive events. Figure 8A shows a scatter plot obtained using this data acquisition gate.
Analysis of these cells now shows that 100% of the cells are labelled with NTHi specific antibody (Figure 8B).
In an identical experiment using cells NOT labelled with NTHi specific antibody, only the expected background
staining is observed (Figure 8C). This supports our conclusion that Syto 9 does label cells and is a useful
parameter to use for gating.
 Back to Flow Cytometry and Microbiology Introductory Page
