

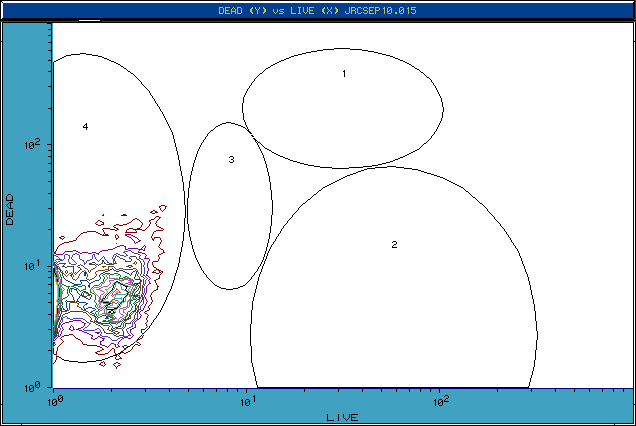
Figure 1: Typical red vs. green fluorescence histogram of Staphylococcus aureus treated with 70% ETOH and stained with BacLight Kit. Control for region 4 (dead).
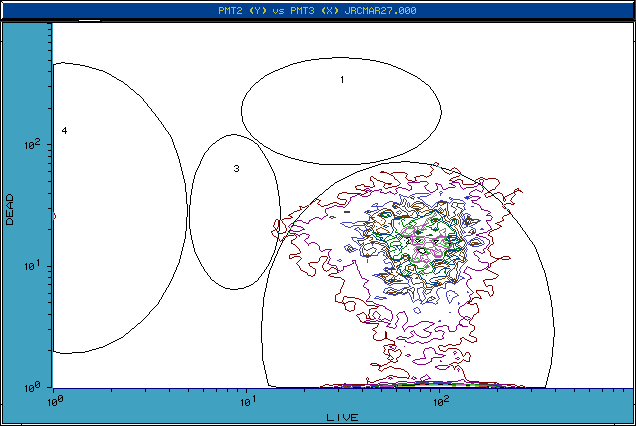
Figure 2: Histogram of Staphylococcus aureus incubated at room temperature and stained with BacLight Kit. Control for region 2 (live).
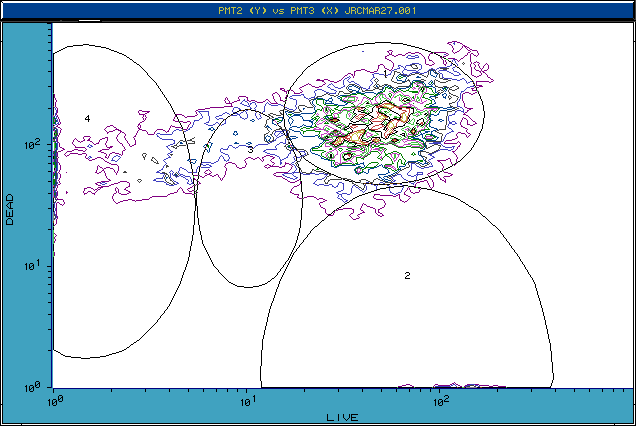
Figure 3: Bivariate contour plot for Staphylococcus aureus heat incubated at 60 degrees Celsius and stained with the BacLight Kit. Region 1 is a mixture of viable and non-viable bacteria.
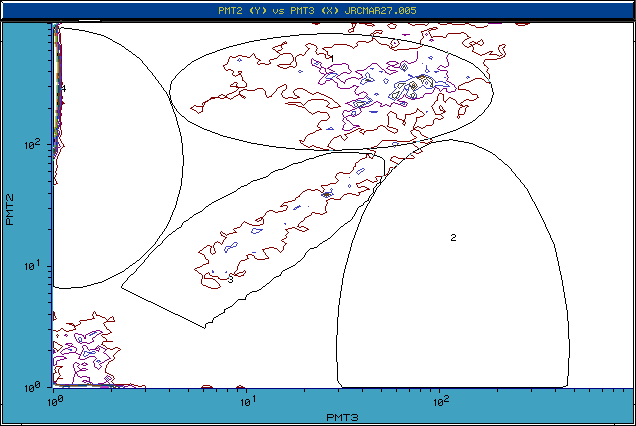
Figure 4: Typical pattern for Staphylococcus aureus treated with Vancomycin (0.5 ug/ml). Bacteria in regions 3 and 4 are non-viable. Region 1 is a mixed population with both viable and non-viable cells.
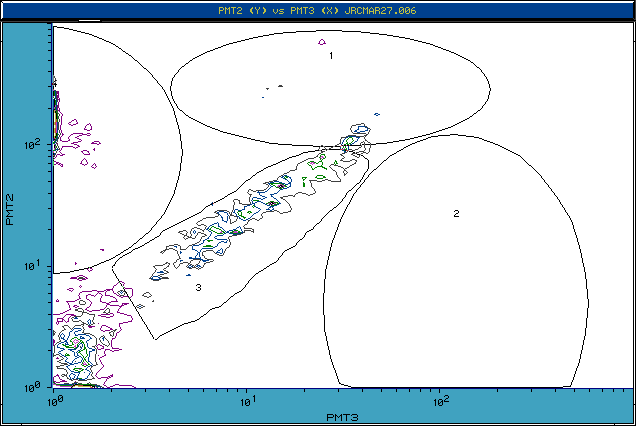
Figure 5:Contour plot of Staphylococcus aureus treated with Vancomycin (2.0 ug/ml). Regions 3 and 4 are non-viable. Region 1 contained a mixture of viable and non-viable bacteria. Upon overnight incubation the viable (Vancomycin resistant) population predominated, overgrew the culture, and stained as a single live population.


 Back to Flow Cytometry and Microbiology Introductory Page
