|
1
|
|
|
2
|
- Linear circuits
- Logarithmic circuits
- Dynamic range
- Fluorescence compensation
|
|
3
|
- Output signal is proportion to the sum and/or difference of their input
signal
- To collect any signal based on stoichiometric relationships e.g. DNA
staining you must have 10 bit resolution
- The higher the accuracy desired the hire the number of bits must be
collected
- Current instruments have 4 decade logarithmic scales thus an ADC must
provide at least accuracy to 1/10,000 of the full scale which equals 1
mV in a 0-10 V scale
- Thus to achieve this accuracy level you must have at least 14 bits of
data (16,384 bits) since 13 bits would only be 8,192 bits
|
|
4
|
- The problem with compensation is that it needs to be performed on linear
data, not logarithmic data. Thus, either the entire electronics must be
built in linear electronics, which requires at least 16 bit A-D
converters, or a supplementary system must be inserted between the
preamp and the display.
- We need the dynamic range for immunologic type markers, but we can’t
calculate the compensation easily using log amps - certainly not without
complex math.
- Flow cytometers amplify signals to values ranging between 0-10V before
performing a digital conversion.
- Assuming this, with 4 decades and a maximum signal of 10 V we have:
|
|
5
|
- Assume we convert linear analog signals using an 8 bit ADC - we have 256
channels of range (2n)
(28-256) corresponding to the range 0-10 V
- Channels difference is 10/256=40mV per channel
|
|
6
|
|
|
7
|
- Consider the 14 bit data (16,384 channels)
- The smallest signal on a 0-10volt scale will be 610 uV per channel
- Thus a 1 channel change produces a value of 1220 uV or 100% possible error at the low end –
since the bottom 10mV of this scale is represented by channels 1-16, the
voltage at channel 16 is 9765 mV or at ch# 15 is 9765 uV or an error of
about 6%
- This is an unacceptable high error at the low end so we must try to
digitize at a higher bit rate say for example 16 bits (65, 536)
- Now the same range as above a 1mV signal will appear in ch# 7 and a 10
mV signal in Ch# 65 giving an error of 6% at the bottom end and only 2%
at the top end
|
|
8
|
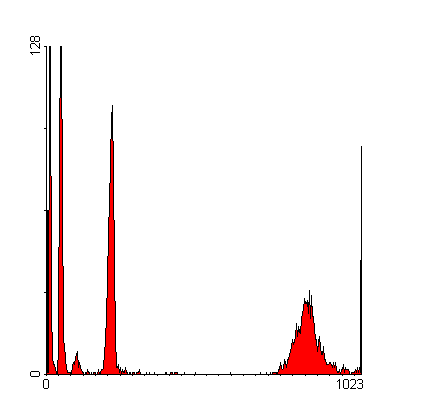
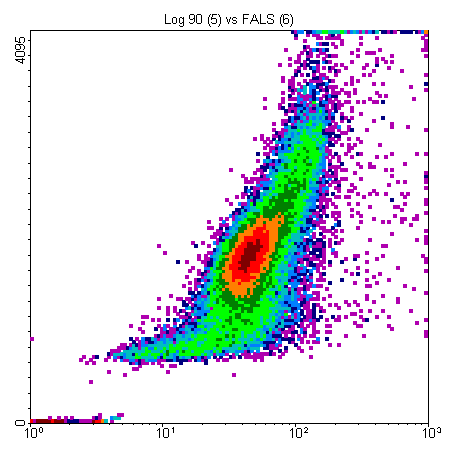
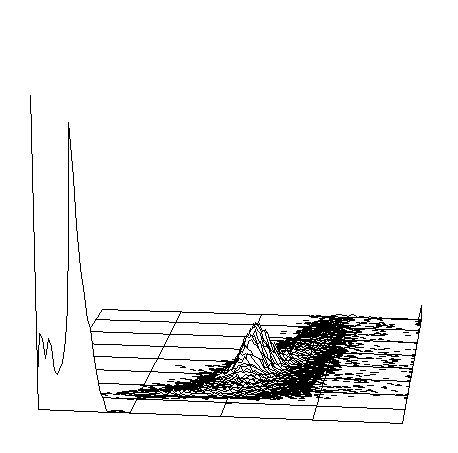
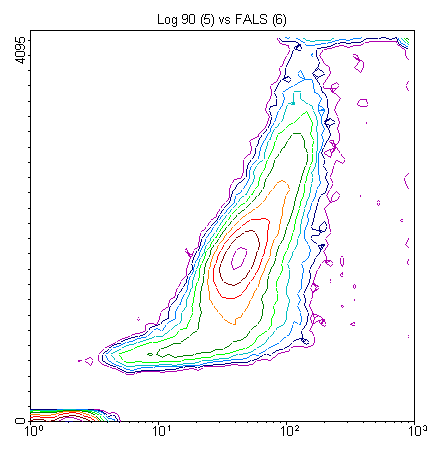
- Compare the data plotted on a
linear scale (above) and a 4 decade log scale (below). The date are
identical, except for the scale of the x axis. Note the data compacted
at the lower end of the the linear scale are expanded in the log scale.
|
|
9
|
|
|
10
|
- Ratio circuits are analog circuits which produce an output proportional
to the ratio of the 2 input signals.
- They are usually made from modules called analog multipliers.
- Examples are calculation of surface density or antigenic receptor sites
by dividing the number of bound molecules by the cell surface area.
- E.g. Could use 2/3 power of
volume to obtain surface area - but few cytometers make this parameter
so can use the square of the cell diameter of scatter instead to
approximate.
- pH can also be measured using ratio circuits
- Calcium ratio (using Indo-1) is also used (discussed in later lecture)
|
|
11
|
|
|
12
|
- DSP processors signal continuously at very high rates
- e.g. Take a compact disc which
samples at 44.1kHz
- Two conversions are performed (one for each stereo channel) of at least
16 bit resolution are performed every 22.7msec (44.1k/1 second)
- Thus for 16 bit data (2 bytes) at 2 samples per measurement we would
have 2 x 44.1 x 2 bytes = 176400 bytes/sec = 10,584,000 bytes/min =
635,040,000 bytes/hour (=620 Mbytes/hour)
- So for really high speed samples we need very high sampling indeed
around 20-40 MHz
- This is very costly and is now being achieved at different levels by the
manufacturers and essentially removes a huge amount of electronics
(pulse width, integration circuits, thresh-holding circuits, comparator
circuits, etc)
|
|
13
|
- Discussed later in series
- Precision, sensitivity and accuracy
3rd Ed. Shapiro p 171-177
|
|
14
|
- Precision: CV
- Sensitivity
- MESF Units
- Accuracy and Linearity
- Noise
- Background
- Laser noise
|
|
15
|
|
|
16
|
|
|
17
|
- The number of antibodies that bind to a specific cell or microbead
population
- Note: ABCs are not necessarily the number of antigens or epitopes on the
cell.
|
|
18
|
|
|
19
|
|
|
20
|
- The slope of the calibration line determined from a 256 Histogram Scale
- Also indicates the number of Histogram Channels per Decade of
amplification.
- Examples:
- Coef of Res = 256/4 = 64.0 HC/Decade
- (4 decade amplifier) 85.3 HC/Decade
- Coef of Res = 256/3 = (3 decade amplifier)
|
|
21
|
- It is the intercept of the calibration line on the ABC axis.
- represents the lowest ABC value theoretically observable in the Window
of Analysis.
- It anchors the left hand corner of the Window of Analysis in Sample
Space
|
|
22
|
|
|
23
|
|
|
24
|
- MESF Units
- Molecules of Equivalent Soluble Fluorochrome
- Accuracy and Linearity
- Noise
- Background
- http://www.cyto.purdue.edu
|

 Notes
Notes